. 2020 Apr 15;9:e49834. doi: 10.7554/eLife.49834

Figure 2. Choice updating is not due to slow and nonspecific drift in response bias.

(a) Signal detection theory-inspired schematic of task performance. The psychometric curve illustrates the average choice behavior. (b) Slow non-specific drift in choice bias, visualized here as drift in the decision boundary, could lead to shift in psychometric curves which persisted for several trials and was not specific to stimulus and outcome of the previous trial. This global bias effect is cancelled when subtracting the psychometric curve of trialt-1 (orange) from trialt+1 (brown). (c) Trial-by-trial updating of decision boundary shifts psychometric curves depending on the outcome and perceptual difficulty of the preceding trial. Subtracting psychometric curves does not cancel this effect. (d) Choice bias of the example rat following a rewarded trial. (e) Similar to d but for population. (f) Choice bias of the example rat in one trial prior to current trial, reflecting global nonspecific bias visualized in b. (g) Similar to f but for population. (h) Subtracting choice bias in trialt-1 from trialt+1 reveals the trial-by-trial choice updating in the example rat. (i) Similar to h but for the population. See Figure 2—figure supplement 1 for details of the normalization procedure.

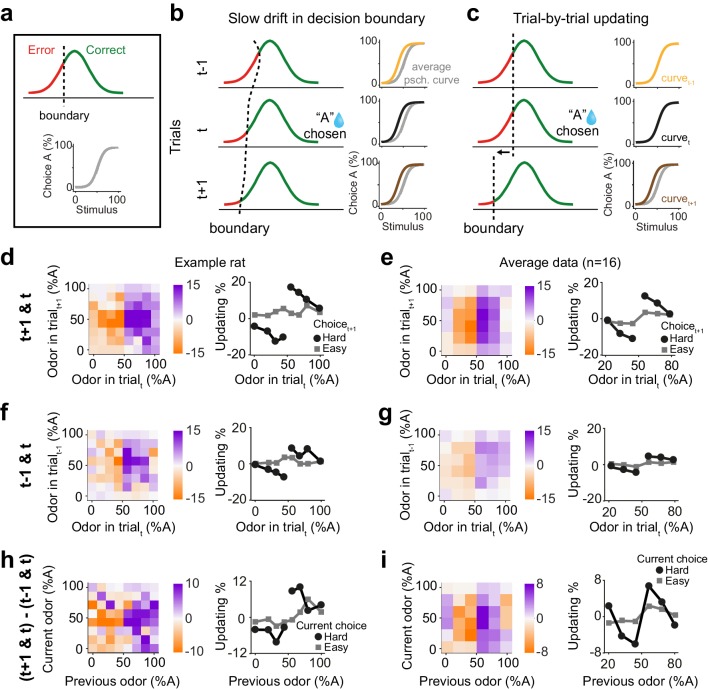
Figure 2.

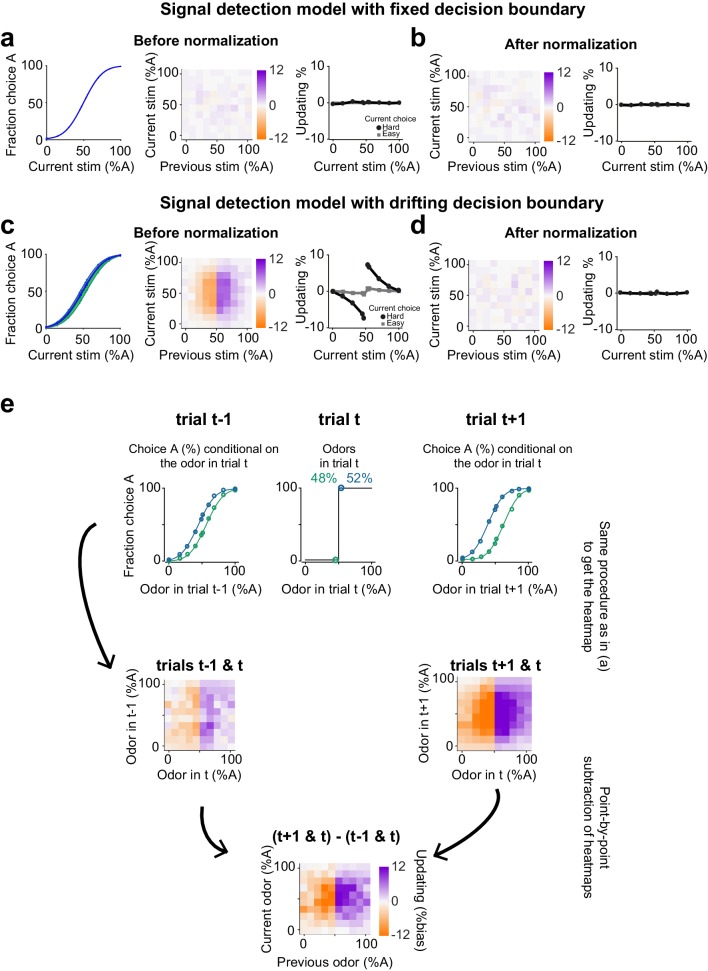
Figure 2—figure supplement 1. Isolation and correction of slowly drifting non-specific choice bias.

Figure 2—figure supplement 1.

(a,b) A simple signal detection theory-based simulation with a fixed decision boundary. In this model, stimuli are drawn from a normal distribution and are compared to a fixed decision boundary (50%) for choice computation. This model generates psychometric curves that are not depending on the previous trial (left panel in a) and hence no updating is observed (middle and right panel in a). Our normalization (explained in e) does not influence updating in this model, as shown in b. (c,d) A signal detection theory-based simulation using a slowly drifting decision boundary. Psychometric curves appear to depend on the previous trial (left panel in c), resulting in apparent updating effect (middle and right panels in c). However, this effect is removed after applying our normalization as shown in d. (e) The normalization procedure for isolating trial-by-trial updating. Upper row middle panel shows the performance for two levels of stimuli (48 and 52%) which were both rewarded, hence the delta function. Upper row left panel shows the psychometric curves separately for trials followed by 48% or 52% stimuli. Any separation between these curves indicates a side bias which extend beyond a single trial. Upper right panel shows psychometric curves separately computed based on whether the stimulus in trial t was 48 or 52%. The full conditional psychometric curves in trial t-1 and t and in trial t and t+1 were used to compute heatmaps (middle row). The heatmap of t-1 was subtracted from the heatmap of t+1 to compute normalized trial-by-trial updating (lowest row).