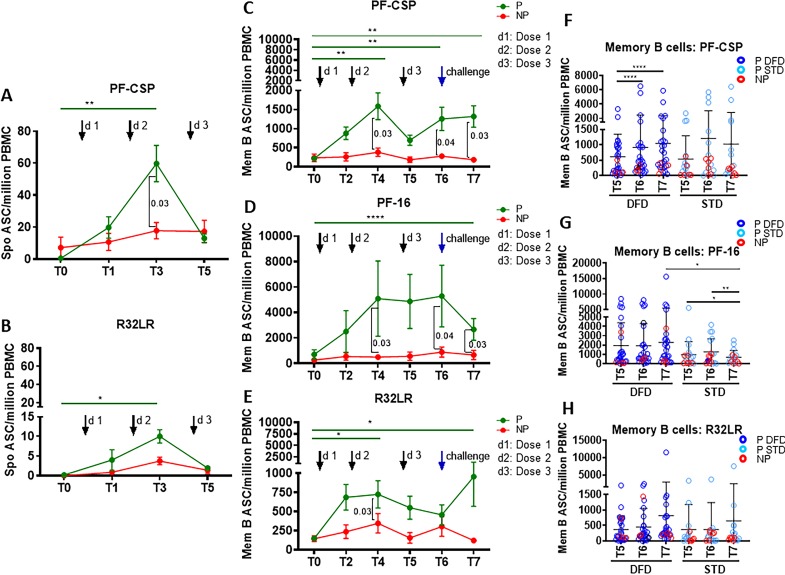
Figure 5. Higher CSP-specific plasmablast and memory B cell ASC responses in the P subjects.
Spontaneous antibody secreting cells (ASC) at T0, T1, T3, and T5 were determined in unstimulated PBMC for plasmablast responses by ELISpot against PF-CSP, PF-16 and R32LR antigens. Memory B cell ASC responses were analyzed at T0, T2, T4, T5, T6 and T7 using ELISpot assay in PBMC stimulated with PF-CSP, PF-16, or R32LR antigens. Line graphs with error bars indicate mean ± standard error of mean (SEM). (A, B) Spontaneous ASC/million PBMC for the protected (P, green line, n = 33) and non-protected (NP, red line, n = 10) study groups for PF-CSP (A) and R32LR (B) antigens. (C–E) Memory B cell ASC/million PBMC for PF-CSP (C), PF-16 (D) and R32LR (E) for P and NP subjects. (F–H) Scatter plots showing memory B cells responses as ASC/million PBMC in the DFD and STD regimens at T5, T6 and T7 for PF-CSP (F), PF-16 (G) and R32LR (H) antigens. Data from the protected group are represented as dark blue open circles for DFD (P DFD) and as light blue open circles for the STD regimen (P STD), whereas data for the non-protected group are represented as red open circles (NP) for both regimens. Statistical analysis was performed using the generalized linear mixed-effects model via Penalized Quasi-Likelihood to accommodate repeated measurements over time. P values shown within the graph refer to significant difference between the P and NP groups at the indicated timepoints. Statistical significance shown as: *, p<0.05; **, p<0.01; ***, p<0.001.


