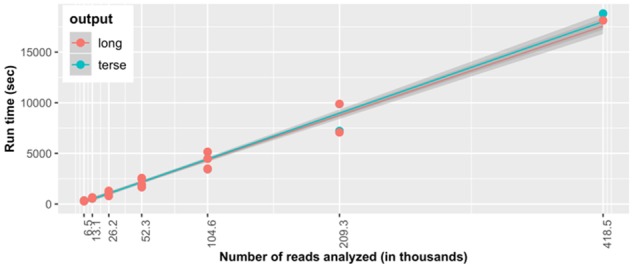
Fig. 4.

Run time assessment of PSORTm 1.0.2. Comparison of run time in seconds as a function of number of analyzed reads from the randomly selected watershed discovery sample. Each point represents each input dataset (of different numbers of reads). Trend lines indicate run time increases linearly for both long and terse formats
