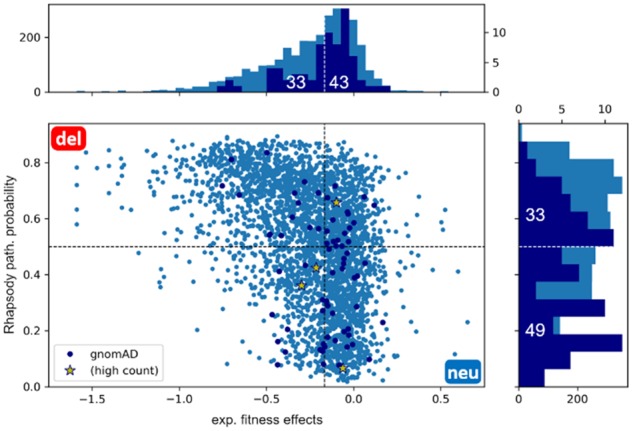
Fig. 6.

Analysis of H-Ras SAVs from gnomAD DB. H-Ras SAVs (dark blue dots) collected from the gnomAD DB found in healthy population are shown along with the results for all SAVS (light blue dots) on the scatter plot between Rhapsody pathogenicity probabilities and experimental fitness scores (Bandaru et al., 2017). ‘High-count’ SAVs (yellow stars) were seen in at least 10 individuals. The marginal plots show the corresponding distributions computed for all variants (light blue) and gnomAD variants (dark blue)
