
Fig. 3.
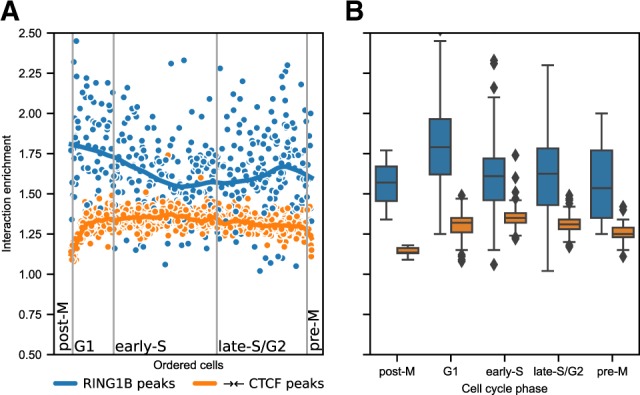
Chromatin looping dynamics across cell cycle. (A) Hi-C interaction enrichment levels for single cells ordered along the cell cycle (Nagano et al., 2017) for CTCF- and RING1B-associated interactions. The former is limited to 100–800 kb distance, while the latter is shown for all distances above 100 kb. Curves represent LOWESS-smoothed data for easier interpretation. (B) Distribution of enrichment values in all cell cycle stages from data in (A)