
Fig. 4.
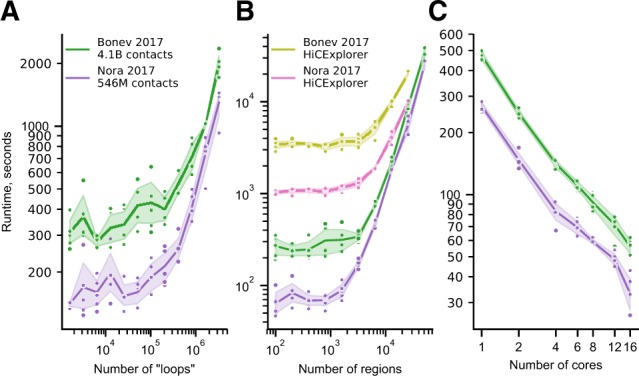
Performance profiling. (A) Runtime (seconds) of coolpup.py with varying number of averaged ‘loops’ for two Hi-C datasets with different depth. (B) Same as (A), but for number of linear regions between which interactions are averaged. Also shown is runtime for HiCExplorer hicAggregateContacts. Note that the longest time-point for HiCExplorer required over 512 Gb RAM and was not computed. (С) Runtime of the same analysis with 5000 linear regions and a varying number of cores. Same colour coding as in (A)