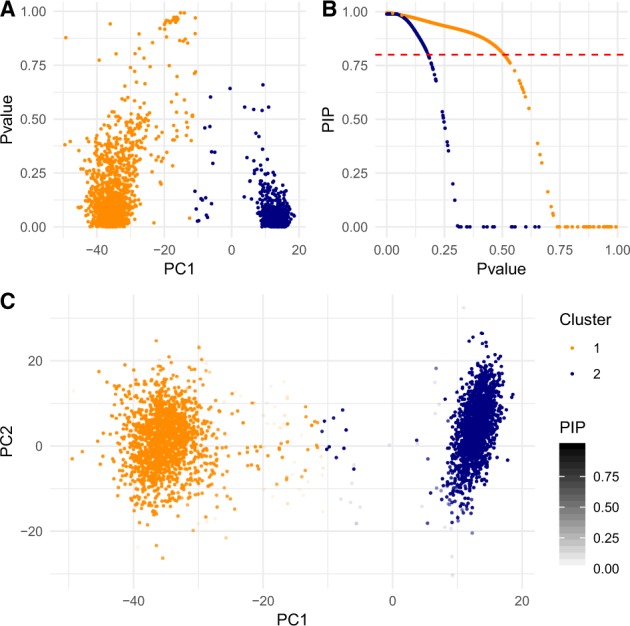
Fig. 4.

Cell identities in the Jurkat: 293T cell mixture data from Zheng et al. (2017). Two distinct cell lines form K = 2 cellular subpopulations. The proposed jackstraw method is applied on the top 10 PCs of UMIs. (A) P-values from the proposed methods are plotted against the first PC. Two colored points correspond to two clusters. (B) At PIP < 0.80, 3.4% of 3381 single cells would be removed. Removing or down-weighting cells with low PIPs serve as feature selection for those with substantial association with presumed cellular subpopulations. (C) PIPs control transparency levels on the PC scatterplot. When PIP = 0, the data point is completely transparent
