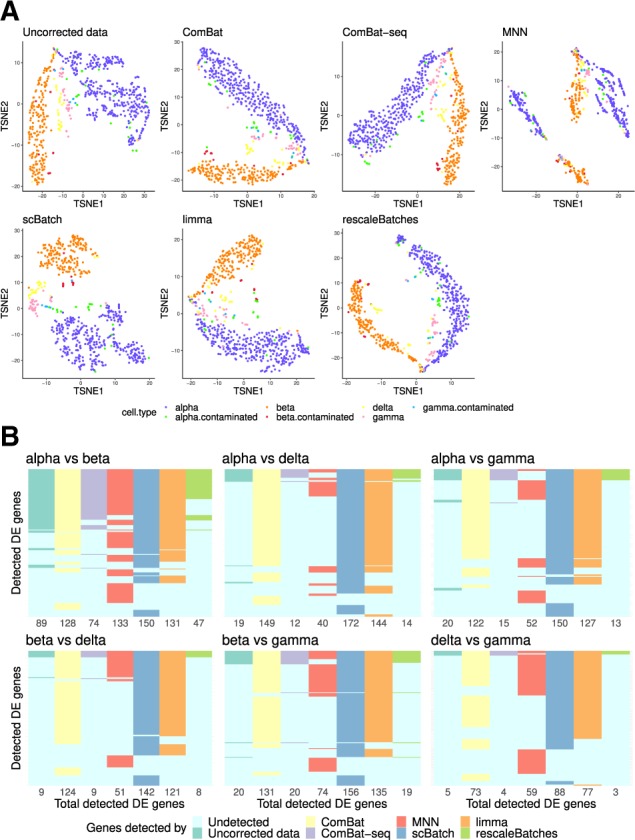
Fig. 5.

Analysis results for the human pancreas data: (A) t-SNE plots of the sample patterns from uncorrected data (normalized raw count data), ComBat-corrected data, MNN-corrected data, scBatch-corrected data, limma-corrected data and rescaleBatches-corrected data, colored by cell types; (B) comparison of the significant genes from pairwise differential-gene tests by Seurat (Satija et al., 2015) with adjusted P-values and log fold-changes >2
