
Fig. 2.
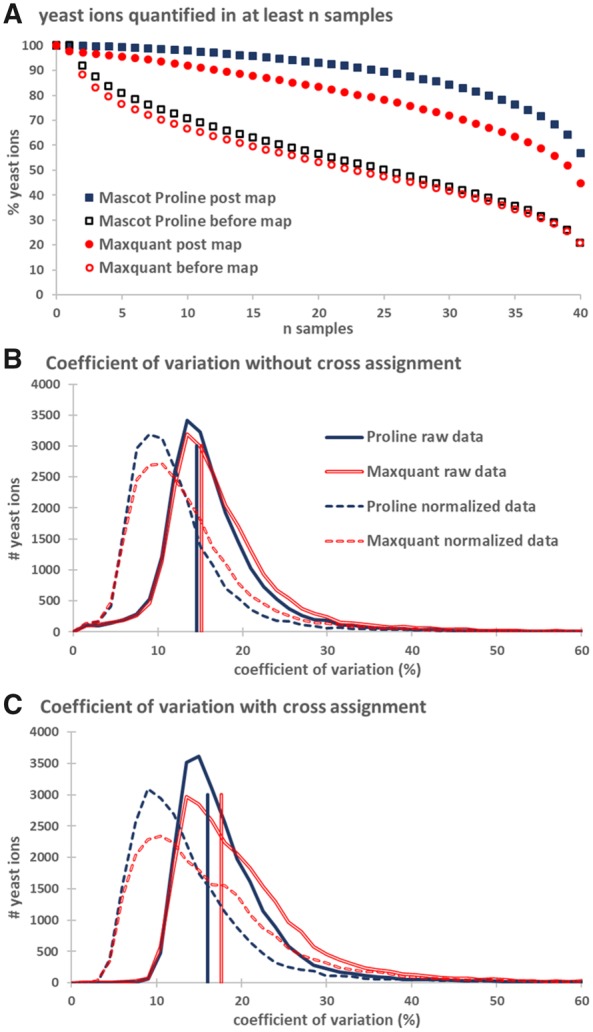
Missing values and CV distributions of yeast ions. (A) Proportions of MVs were represented as percentages of ions matching a yeast protein for which an abundance value was defined in more than n samples. The proportion of ions quantified in the 40 runs was different for Proline (57%) and MaxQuant (45%). (B) CV distribution of yeast ions before applying the cross-assignment procedure. Vertical lines indicate median CV values, 15.2% and 14.6%, respectively, for MaxQuant and Proline. (C) CV distribution of yeast ions after cross-assignment. Median CV values were increased to 17.6% and 16% for MaxQuant and Proline, respectively. In both (B) and (C), solid lines represent CV values calculated from raw intensities, whereas dashed lines represent CV values after median normalization