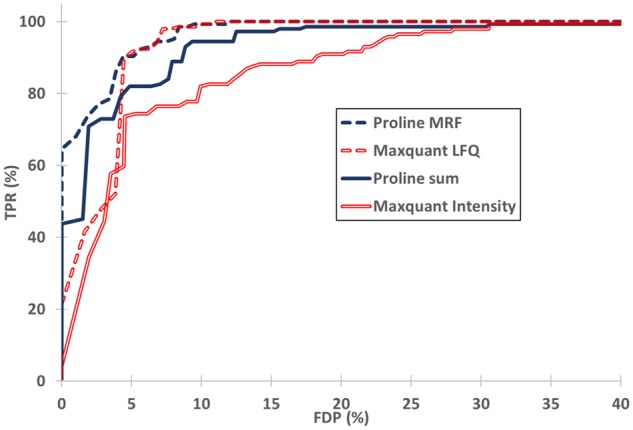
Fig. 5.

Differential analysis results in terms of sensitivity and FDP. For each software, proteins from the mixed dataset were classified as variant through the application of q-value thresholding. Sensitivity (TPR = TP/144, TP UPS1 proteins) was plotted as a function of FDP [FDP = FP/(TP+ FP), FP yeast proteins]
