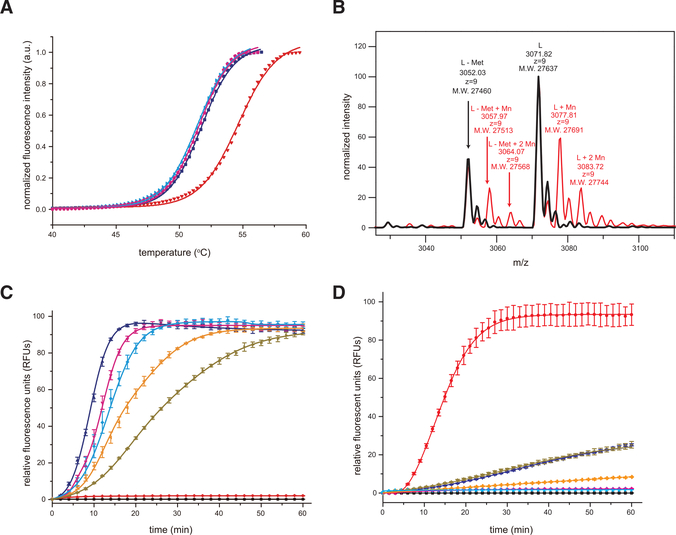
Figure 3. The SFTSV L Endonuclease Activity Is Sensitive to Divalent Cations.
(A) Thermal stability of SFTSV L 1–231 aa protein in the absence or presence of 2-μM divalent cations. No divalent cations, blue; manganese (Mn2+), red; magnesium (Mg2+), cyan; and calcium (Ca2+), magenta. The lines represent the non-linear fits of the normalized fluorescence curves to the Boltzmann equation.
(B) Intact mass measurement of SFTSV L 1–231 aa protein using LC-MS. Native mass spectra of SFTSV L 1–231 aa (black) and SFTSV L1–231 aa with MnCl2 (red) from charge state +9 are shown. 27,637, 27,691 and 27,744 Da are masses that represent SFTSV L residues 1–231 with first methionine modified (+46 Da) His6-tag, plus 0, 1, or 2 Mn2+. 27,460, 27,513 and 27,568 are masses that represent SFTSV L residues 1–231 with first methionine cleaved His6-tag, plus 0, 1, or 2 Mn2+.
(C) FRET-based endonuclease activity of SFTSV L 1–231 aa was measured by monitoring fluorescence intensity using λex/λem = 485 nm/535 nm. Increasing concentrations of SFTSV L 1–231 aa (2 μM, blue; 1 μM, magenta; 0.5 μM, cyan; 0.25 μM, orange; 0.125 μM, dark brown) were incubated with a 100-nM single-stranded RNA (ssRNA) probe. Buffer only (black) and substrate only (red) were included as blank and background controls, respectively. Each data point represents the average of three independent runs with error bars representing the standard deviation, which was then fit using a four-parameter log curve.
(D) Active site mutations severely impair SFTSV endonuclease activity. FRET-based endonuclease assays were performed in the presence of 1-μM SFTSV wild-type (red) or SFTSV mutants (H80A, blue; D92A, dark brown; D112A, magenta; E126A, orange). Buffer only (black) and substrate only (cyan) were included as blank and background controls, respectively. Experiments were carried out in triplicate and average data are shown with error bars representing the standard deviation.

