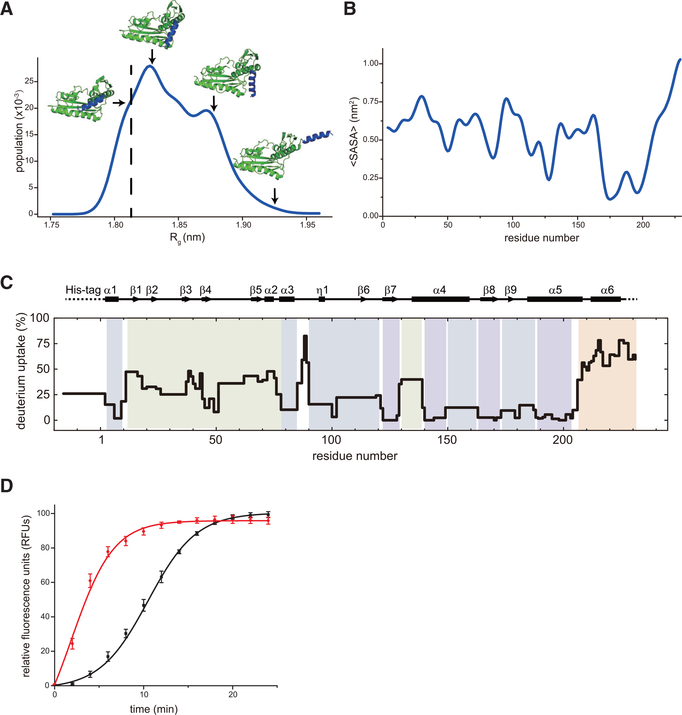
Figure 4. Conformational Dynamics C-Terminal α6 Helix of SFTSV L Protein Modulates Its Endonuclease Activity.
(A) Dynamic simulation of SFTSV L 1–231 aa. The C-terminal α6 helix (colored in blue) is predicted to be very flexible.
(B) The average solvent accessible surface area (SASA) of each residue in SFTSV L 1–231 aa.
(C) Deuterium uptake in SFTSVL1–231 aa from HDX-MS. The deuterium uptake on SFTSV L1–231 aa is mapped onto its sequence and secondary structure with color for exchange time at 120 s of exposure in a D2O buffer (Figure S5). Groups of residues with similar differential deuterium exchange rates are colored according to a gradient for HDX-MS rates in Figure S5.
(D) FRET-based endonuclease assays of SFTSV L 1–231 aa (black) and SFTSV L 1–208 aa (red). Experiments were carried out in triplicate and average data are shown with error bars representing the standard deviation.

