
FIGURE 1.
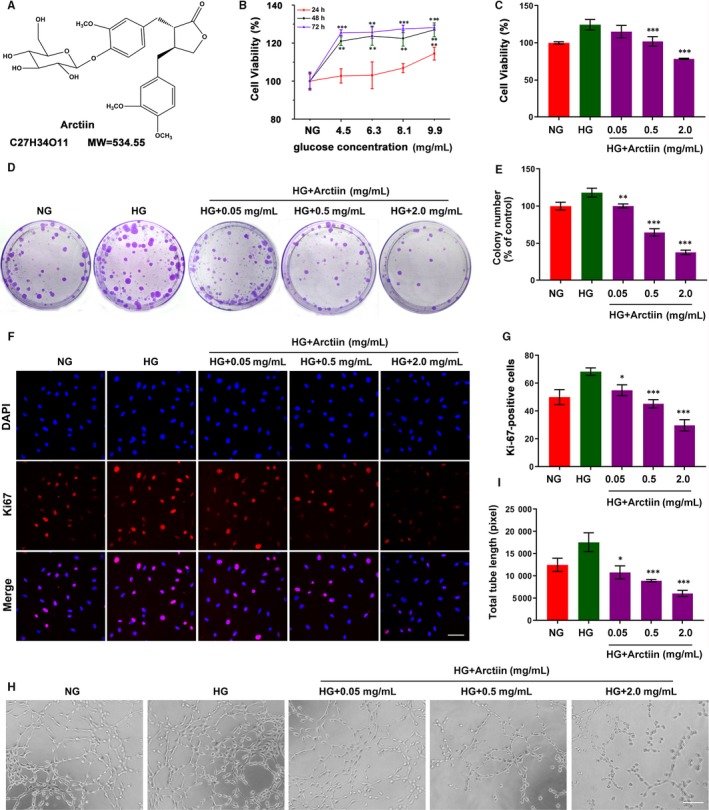
Arctiin inhibits HG‐induced cell proliferation and tube formation in HRCECs. (A) Chemical structure and molecular weight of arctiin. (B) Effect of different high glucose (HG) concentrations (4.5, 6.3, 8.1, 9.9 mg/mL) on cell viability at different time‐points in HRCECs. (C) HRCECs were treated with HG (4.5 mg/mL) without or with different concentrations of arctiin (0.05, 0.5 or 2.0 mg/mL) for 48 h, and cell viability was detected by MTT assay. (D‐E) The anti‐proliferative activity of arctiin on HG‐treated HRCECs was evaluated by colony formation assay, and the number of cell colonies was counted. (F‐G) HRCECs were treated with HG (4.5 mg/mL) without or with different concentrations of arctiin (0.05, 0.5 or 2.0 mg/mL) for 48 h. The cells were immunostained with Ki67 (Red) and DAPI (Blue). Photographs were obtained by confocal microscopy, and the quantification of Ki67‐positive cell was calculated by Zeiss LSCM image examiner software. Scale bar: 50 µm. (H‐I) The formation of capillary‐like structures was photographed with a microscope, and the quantification of total tube length was calculated by ImageJ software. Scale bar: 250 µm. All data are presented as the mean ± SD (*P < .05, ** P < .01, *** P < .001 vs. HG group)