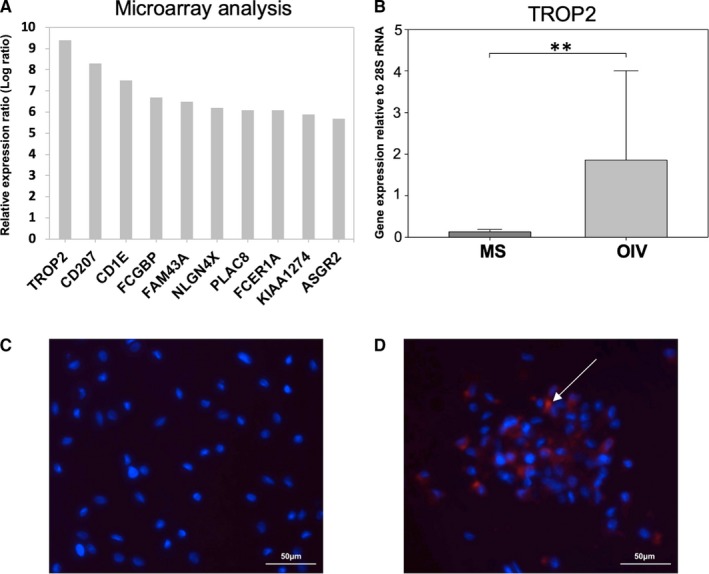
FIGURE 6.

Expression of TROP2. mRNA microarray analysis shows the ten most up‐regulated genes on OIV (A). The bar chart (B) displays the increased expression of TROP2 on OIV compared with MS (*P < .05). Immunohistochemistry (fluorescence microscopy, magnification 40×) of MS (C) and OIV (D) shows TROP2+ cells (red, white arrow) on OIV. Dapi counterstaining (blue) was performed to visualize cell nuclei
