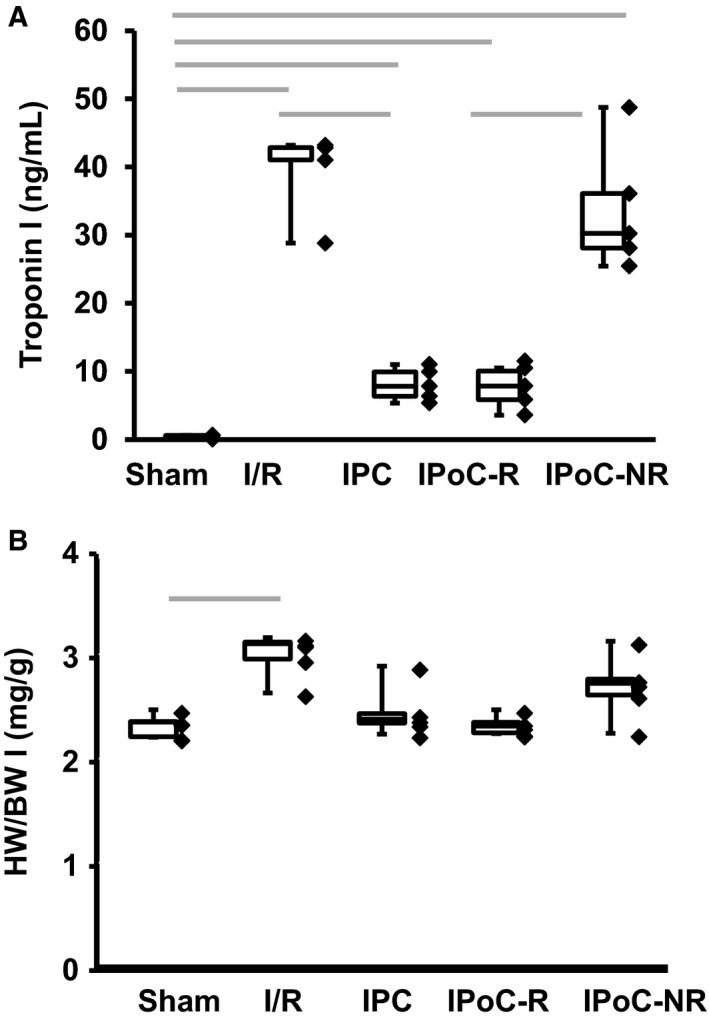
Figure 2.

Infarct sizes and hypertrophy in different groups. A, Plasma troponin I levels are shown for all five groups as box and whisker plots with range (whiskers) and 25%, 50% and 75% quartiles. Individual data points are also indicated. B, Heart weight to bodyweight (HW/BW) as box and whisker plots. Grey bars indicate group differences with P < .05
