Figure 4.

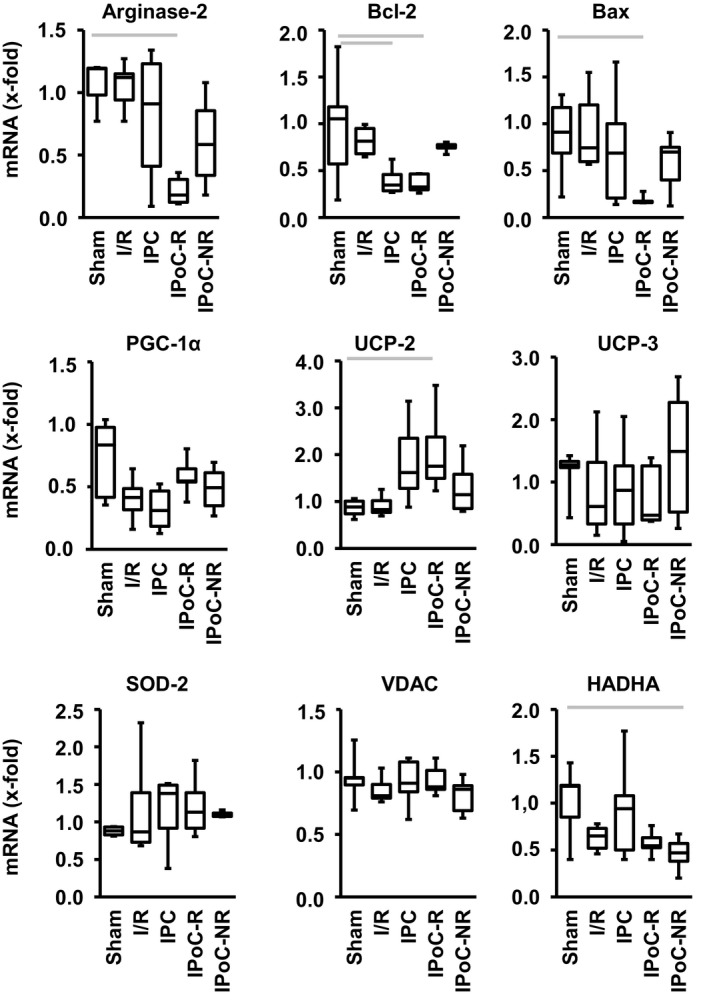
Differential mRNA expression of mitochondrial proteins in post‐infarct hearts. Data are given as box and whisker plots. Grey bars indicate group differences with P < .05

Differential mRNA expression of mitochondrial proteins in post‐infarct hearts. Data are given as box and whisker plots. Grey bars indicate group differences with P < .05