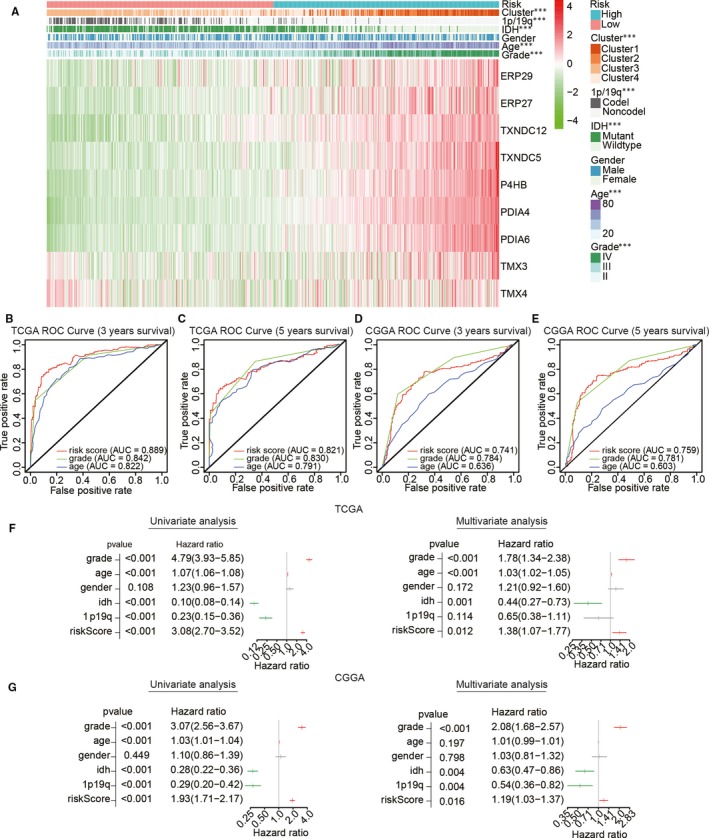
Figure 6.

Relationship between risk score, clinicopathological features and clusters. (A) Heat map depicting the expression levels of the nine PDI family members in low‐ and high‐risk gliomas. The distribution of clinicopathological features was compared between the low‐ and high‐risk groups. ***P < .0001. (B–E) The predictive efficiency of the risk score, WHO grade and age in the training (TCGA) data set (B, C) and validation (CGGA) data set (D, E), shown by ROC curves based on 3‐ and 5‐year survival rates. (F, G) Univariate and multivariate Cox regression analyses of the association between clinicopathological factors, risk score and overall survival of patients in TCGA (F) and CGGA (G) data sets. ***P < .0001
