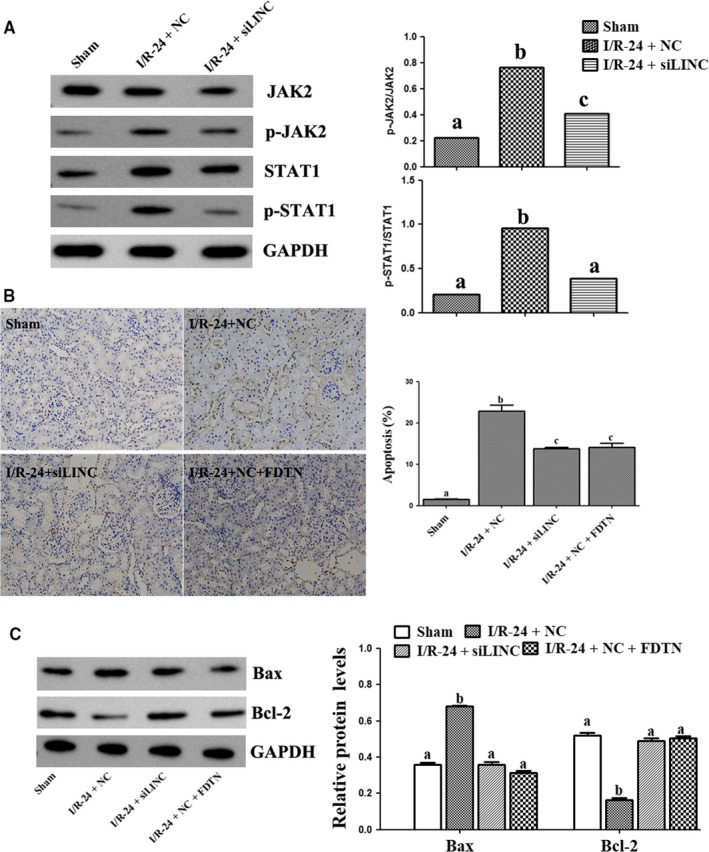
FIGURE 6.

The relationship between LINC00963 and JAK2/STAT1 pathways on I/R‐induced AKI rat model. A, Expression of p‐JAK2 and p‐STAT1 under different conditions. B, TUNEL staining and cell apoptosis proportion of different groups. C, The protein levels of Bax and Bcl‐2. Data are expressed as mean ± SEM, and different letters represent significant differences (P < .05) between groups
