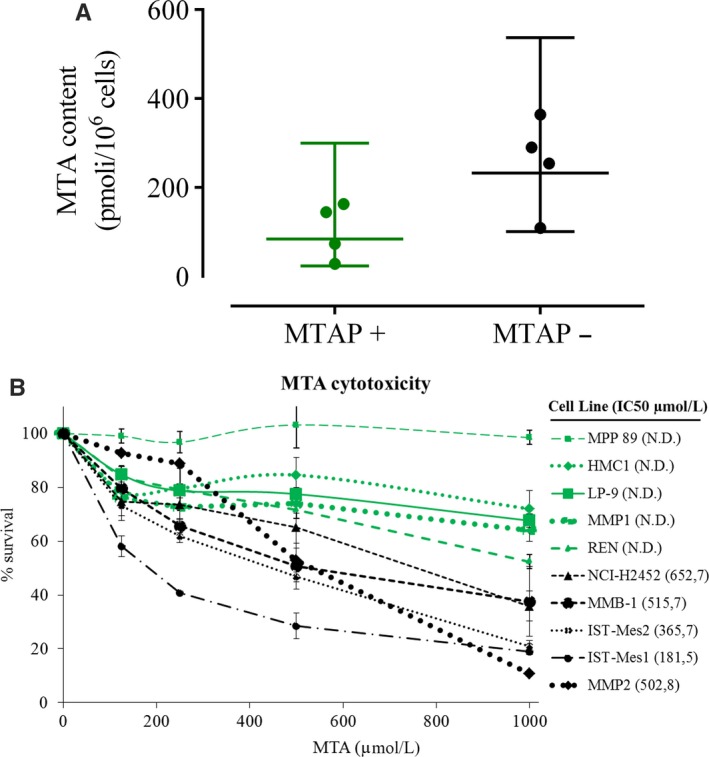
Figure 2.

MTAP‐deleted cells accumulate MTA and are susceptible to its further addition. A, Intracellular MTA levels were measured by high‐performance liquid chromatography‐tandem mass spectrometry (LC‐MS/MS) in a panel of 8 cell lines including 4 MTAP‐deficient MM cell lines (IST‐Mes1, IST‐Mes2, MMB‐1 and NCI‐H2452) and 4 MTAP‐proficient normal mesothelial (LP‐9 and HMC‐NEO) and MM (REN and MPP 89) cell lines. The dot plot reports the MTA levels both individually for each cell line (symbols) and as mean values (lines) with standard deviation calculated on all cells for each group. Each data point represents the mean of at least two independent measures for each cell line. The means with standard deviations of MTA levels for each cell line are reported in Table S3. Statistical analysis was performed by two‐sided unpaired Student's t test, and significance was indicated with *: (P < .05). On average, MTAP‐deficient cells have approximately 2.5 times the intracellular MTA level of MTAP‐intact cells (mean MTA level in MTAP‐deficient cells = 102.5 pmol/106 cells; mean MTA level in MTAP‐intact cells = 254.4 pmol/106 cells). B, Seventy‐two hours IC50 values of MTA for the MTAP‐deleted cells, as determined through SRB assay; MTA IC50 values were not determinable (ND) for MTAP‐positive cells under our experimental conditions. Cell viability data were expressed as percentage with respect to the control cells treated with dimethyl sulfoxide (DMSO) alone; the means and standard deviations of three experiments are shown
