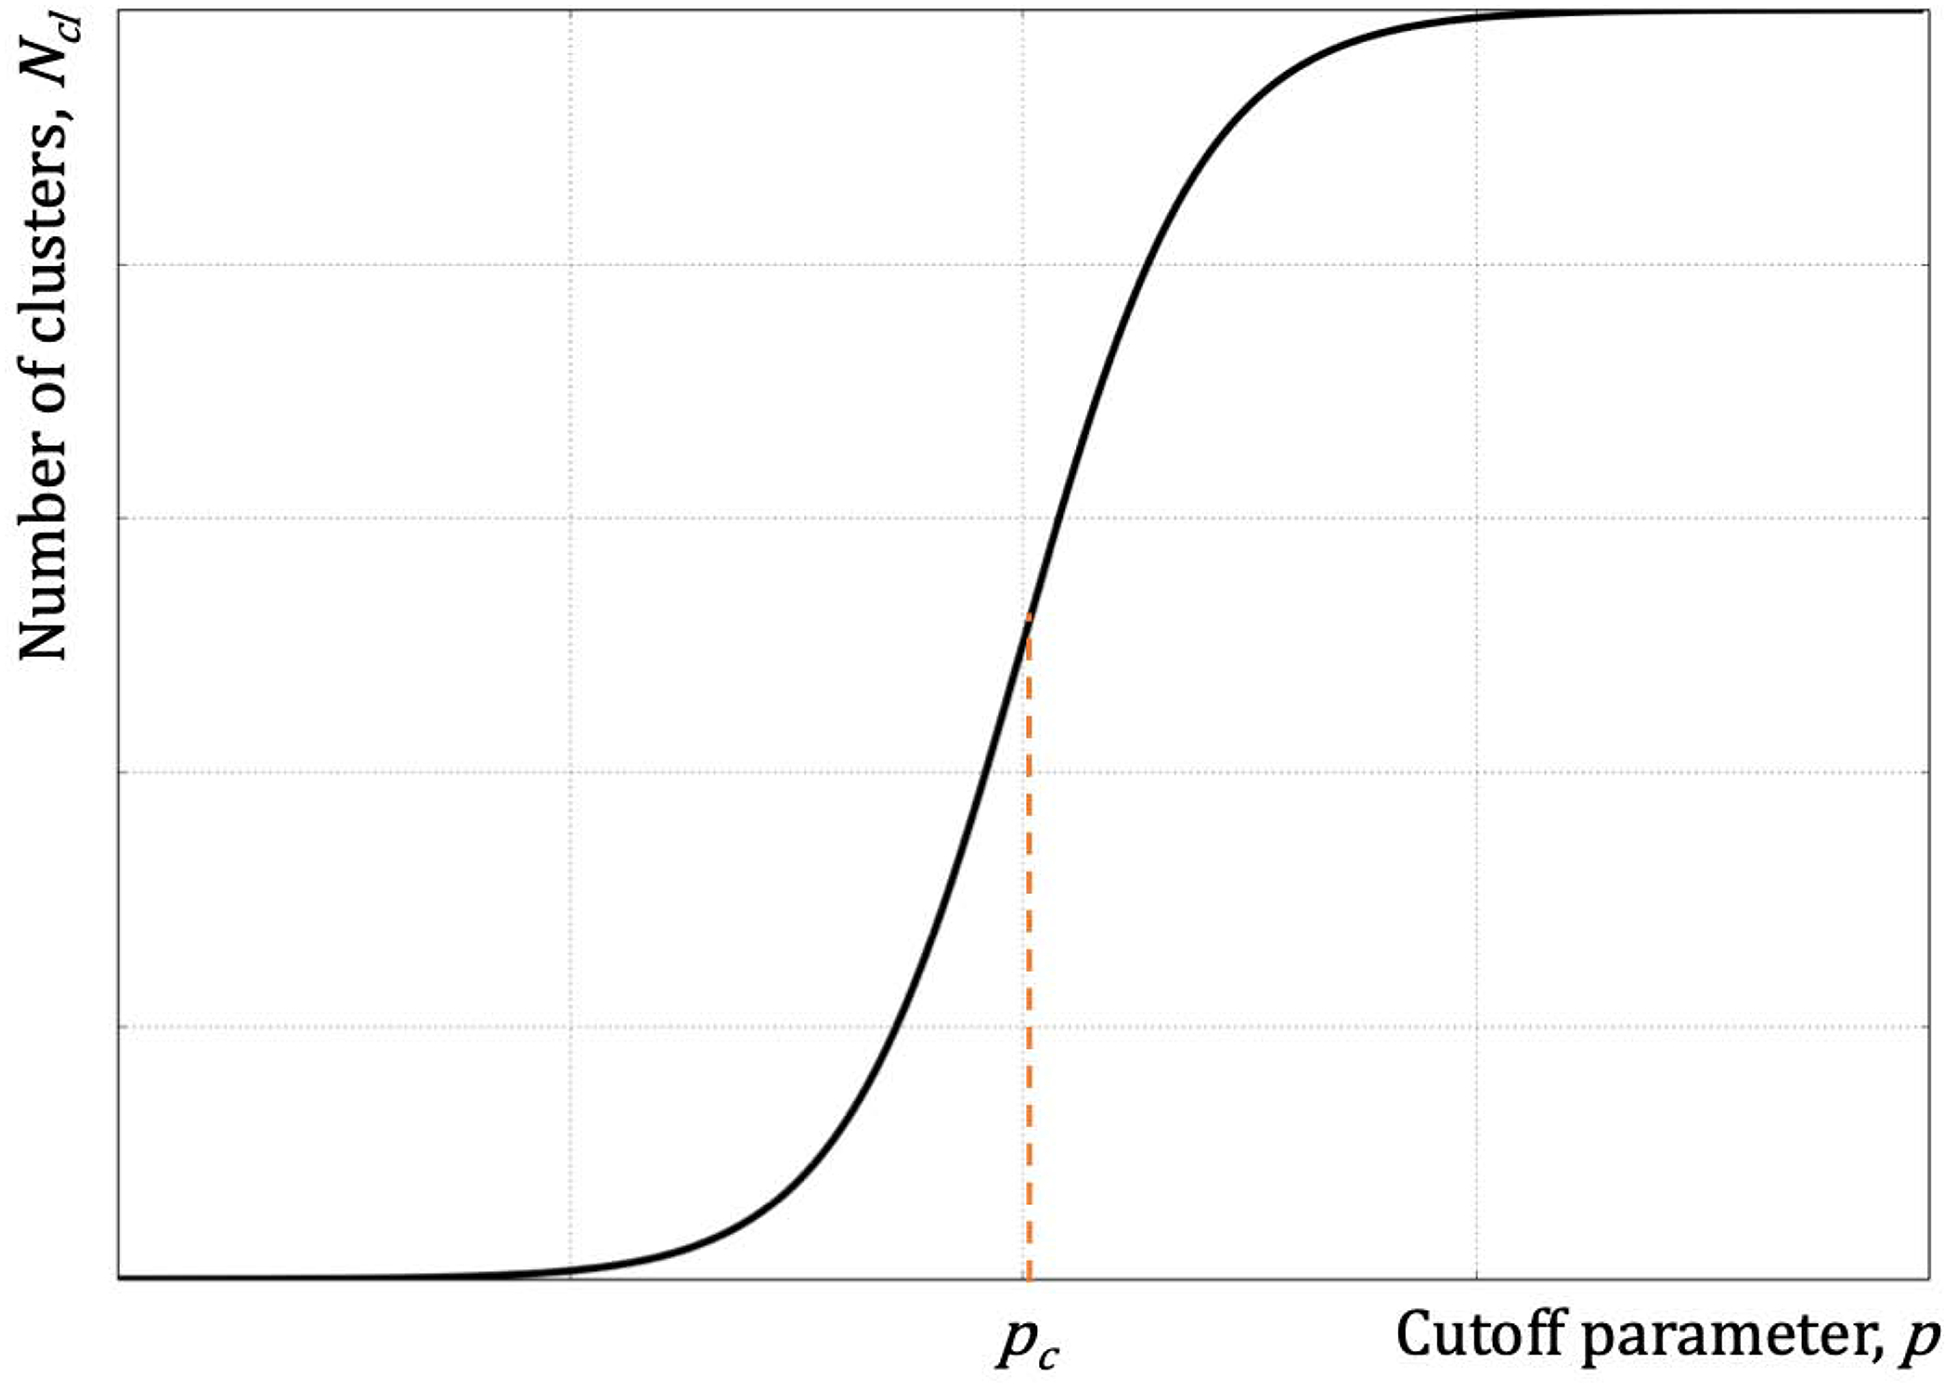
Figure 6. The dependence of the size of the largest cluster on the cutoff parameter, p, is a sigmoidal curve.

The midpoint of the transition, pc, denotes the critical regime with the appearance of clusters of all sizes with one maintaining the majority of the elements.
