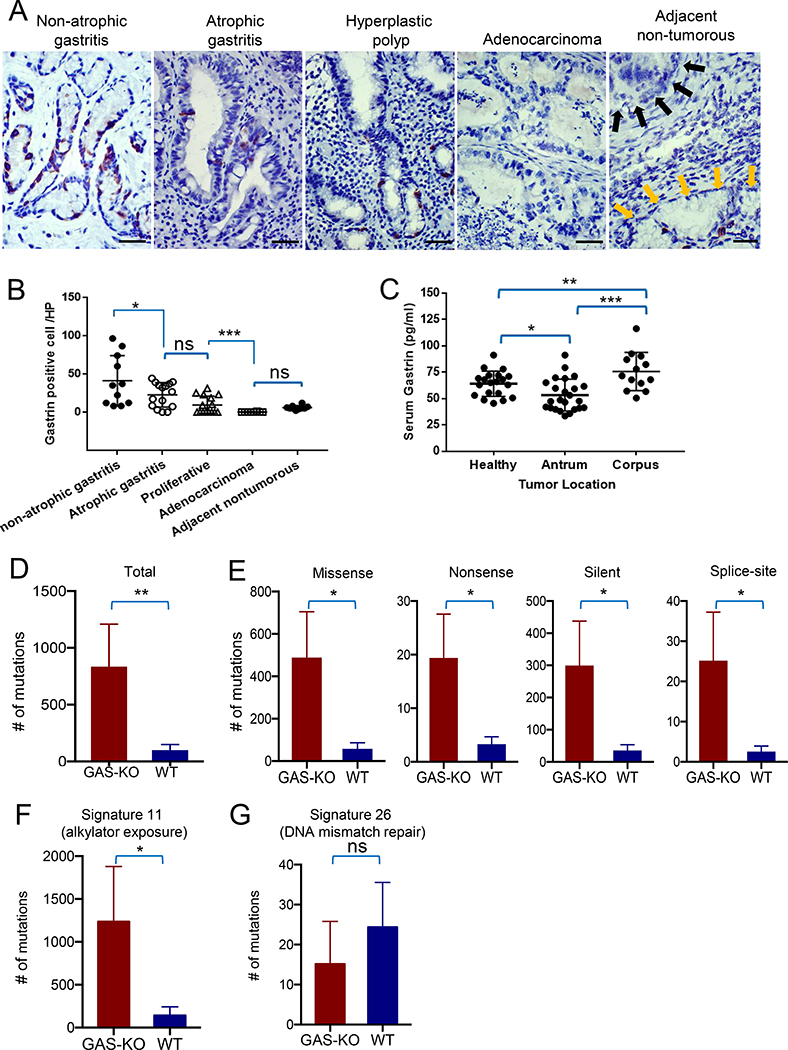
Figure 7. Decreased gastrin expression is associated with progression of human gastric antral neoplasia.
(A) Immunohistochemical expression of gastrin in gastric antral preneoplastic lesions and gastric antral cancer. Patients with non-atrophic gastritis (n=10), atrophic gastritis (n=15), hyperplastic polyp (n=15), adenocarcinoma (n=10). Right panel shows a section of adjacent nontumorous tissue with rare gastrin+ cells (yellow arrows), while tumor is shown with black arrows. (B) Quantification of gastrin+ cells per high power field in the four groups of patients shown in (A). (C) Relationship between serum gastrin level and tumor location in patients with gastric cancer. Dot plot graph show gastrin levels (pg/ml) in patients with corpus cancer (n=13), antrum cancer (n=24), and healthy controls (n=20). (D) The average number of mutations in tumors from GAS-KO (n=5) and WT mice (n=7), based on exome sequencing. (E) Spectrum of mutations in antral tumors developing in GAS-KO mice compared to WT mice. Bar graph showing quantification and comparisons of major classes (missense, silence, nonsense and splice site) of exome mutations in antral tumors between GAS-KO (n=5) and WT (n=7) mice. (F, G) Bar graph showing quantification of mutations for two prominent COSMIC mutational signatures in GAS-KO (n=5) versus WT (n=7) antral tumors. Scale bars represent 50 μm (A). Data are expressed as the mean ± SD * P<0.05, ** P<0.01, *** P<0.001. See also Figure S6.

