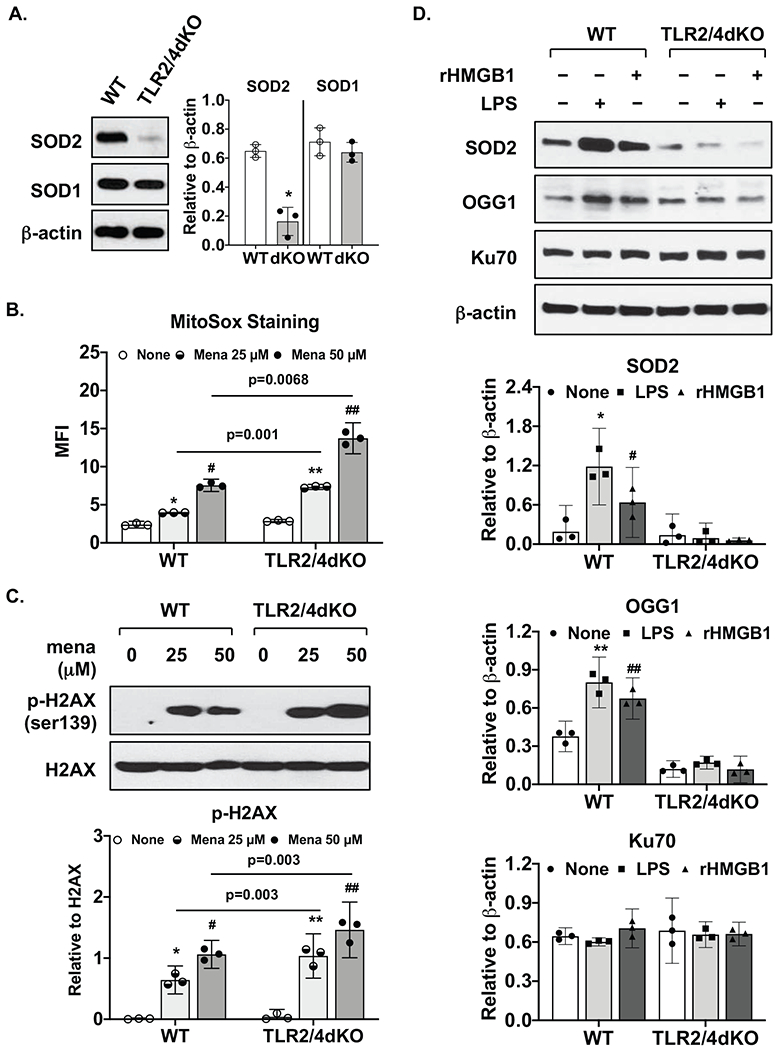
Figure 1. Chondrocytes deficient in TLR2 and TLR4 exhibited reduced anti-oxidative stress capacity.

WT and TLR2/4dKO chondrocytes at basal levels (A) or after stimulation with LPS (1 μg/ml) and rHMGB1 (2 μg/ml) for 18 hours (D) were examined for expression of SOD1, SOD2, OGG1 or Ku70 by Western blotting. β-actin was included as a loading control. WT and TLR2/4dKO chondrocytes were treated with menadione at 25 and 50 μM for 1 hour, mitochondrial superoxide generation (B) was assessed by flow cytometry analysis of mean fluorescent intensity (MFI). Phosphorylation and expression of H2AX were examined by Western blotting (C). Densitometry analysis of Western blot data from 3 independent experiments was included. Student t-test (A) and repeated measures two-way ANOVA analysis (B,C,D) were used for statistical analysis. There was a significant interaction between the effect of menadione and genotype on mitochondrial superoxide generation in B (F(2, 8)=91.73, p<0.0001) and on normalized phosphorylation of H2AX in C (F(2, 8)=9.91, p=0.0068). There was also a significant interaction between the effect of treatment (LPS or rHMGB1) and genotype on normalized SOD2 expression F(2, 8)=79.18, p<0.0001 and normalized OGG1 expression F(2, 8)= 23.46, p=0.0005, but not normalized Ku70 expression. Sidak’s test on the effect of menadione at each concentration between WT and TLR2/4dKO (B, C) and Tukey’s test on the effect of each treatment within WT or TLR2/4dKO (B,C,D) were followed up. In A, *p=0.002, relative to WT. In B, * p=0.0065, # p<0.0001 relative to none in WT, ** p=0.0003 and ## p=0.003 relative to none in TLR2/4dKO. In C, * p=0.012, # p=0.005 relative to none in WT, **, ## p=0.008 relative to none in TLR2/4dKO. In D. * p=0.0004 and # p=0.03 for SOD2, ** p=0.045 and ## p=0.021 for OGG1, relative to none in WT.
