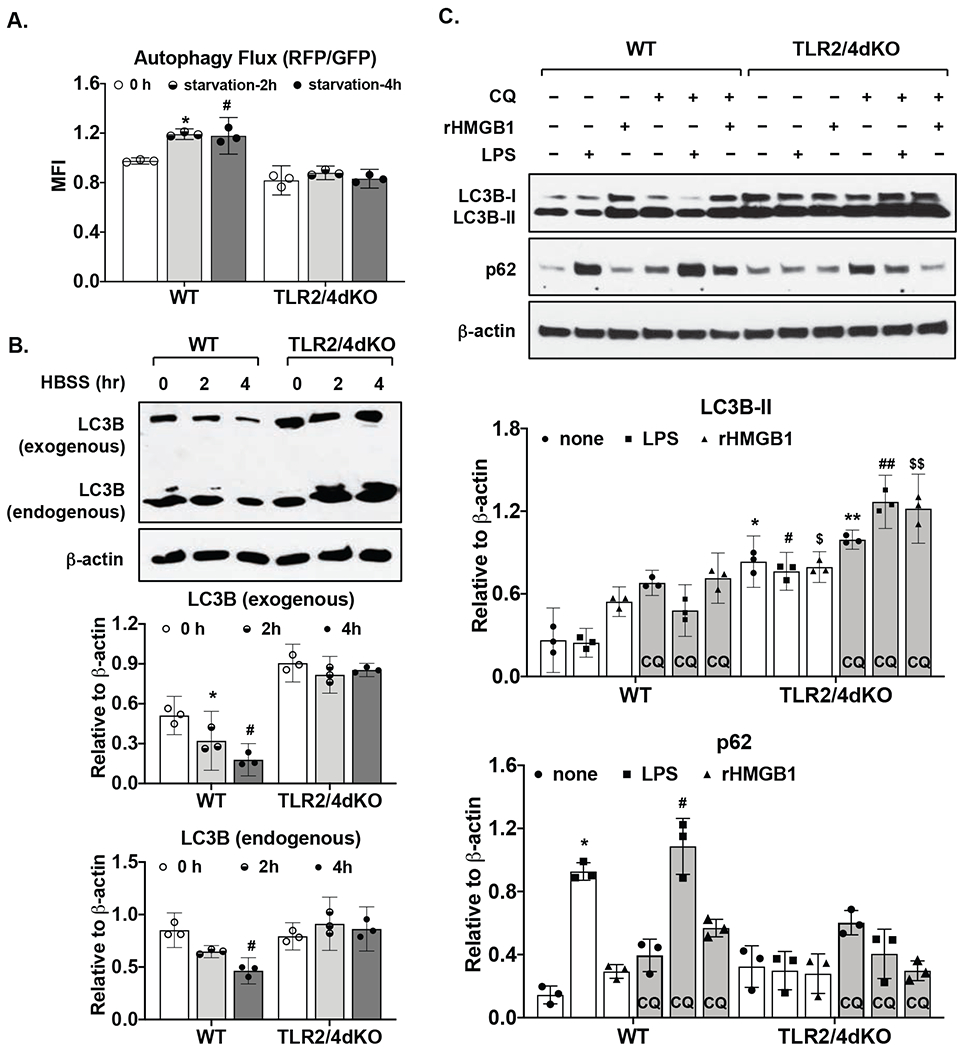
Figure 2. Autophagy flux was impaired in chondrocytes deficient in TLR2 and TLR4.

Both WT and TLR2/4dKO chondrocytes were transfected with a tandem mRFP and GFP fluorescent-tagged LC3 (ptfLC3) plasmid for 48 hours. The cells were then subjected to nutrient starvation in HBSS for 2 and 4 hours, followed by flow cytometry analysis of mean fluorescence intensity of RFP and GFP. Autophagy flux was determined by the ratio of RFP/GFP (A). Expression of endogenous and exogenous LC3B that was appeared as higher molecular weight conjugates of mRFP-GFP-LC3 on the same blot was examined by Western blotting (B). WT and TLR2/4dKO chondrocytes were stimulated with LPS (1 μg/ml) and rHMGB1 (2 μg/ml) for 18 hours in the presence or absence of choloroquine (CQ, 50 μM). Expression of p62 and LC3B was examined by Western blotting (C). β-actin was included as a loading control. Densitometry analysis of Western blot data from 3 independent experiments was included. Repeated measures two-way ANOVA was used for statistical analysis. There was a significant interaction between the effect nutrient starvation and genotype on autophagy flux (RFP/GFP) F(2, 8)=18.85, p=0.0009) in A, on normalized exogenous LC3 expression F(2, 8)=33.18, p=0.0001 and normalized endogenous LC3 expression F(2, 8)=16.7, p=0.001) in B. There was also a significant interaction between treatment (LPS or rHMGB1) and genotype on normalized LC3B-II expression F(5, 20)=11.46, p<0.0001 and normalized p62 expression F(5, 20)=48, p<0.0001 in C. Tukey’s test on the effect of nutrient starvation or treatment within WT or TLR2/4dKO (A,B,C) and Sidak’s test on the effect of each treatment between WT and TLR2/4dKO (C) were followed up. In A, *p=0.007, #p=0.049, relative to 0 h. In B, * p=0.04, # p=0.005 relative to 0 hour in WT for exogenous LC3B, #p=0.017 relative to 0 hour in WT for endogenous LC3B. For LC3B-II in C, * p=0.0009, # p=0.0002, $ p=0.014 relative to none, LPS and rHMGB1, respectively, in WT, ** p=0.003, ## p=0.001, $$ p=0.018 relative to none, LPS and rHMGB1 respectively, in WT in the presence of choloroquine. For p62 in C, * p=0.01 and # p=0.018 relative to none in WT and WT in the presence of choloroquine, respectively.
