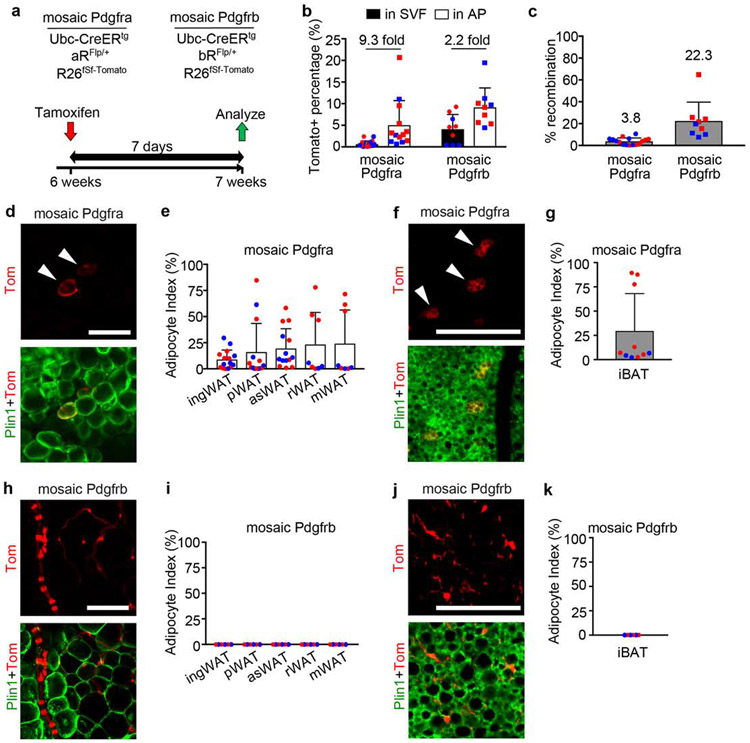
Figure 2. Short term adult mosaic labeling: Pdgfra-lineage labels adipocytes and Pdgfrb-lineage labels mural cells.
(a) Mosaic Pdgfra and Pdgfrb genotypes and experimental scheme for labeling induced at 6-weeks old with 1x Tmx (100mg/kg) and analysis after 7 days. (b) Flow cytometry of Tomato+ cells in the SVF or AP fraction of ingWAT. Tomato+ % shown + SD, and fold enrichment of Tomato+ AP within Tomato+ SVF (n = 13 Pdgfra, 9 Pdgfrb). (c) qPCR for recombination efficiency in Pdgfra (n=13) or Pdgfrb (n=9) mosaics. Average recombination + SD. (d-k) Whole mount adipose tissue with Tomato lineage labeling and Plin1 immunofluorescence with quantification of adipocyte index + SD for each tissue. (d) Pdgfra-lineage labeling in ingWAT (arrowheads = WA). (e) Adipocyte index for mosaic Pdgfra WAT (n = 8-15). (f) Pdgfra-lineage labeling in iBAT (arrowheads = BA). (g) Adipocyte index for mosaic Pdgfra iBAT (n = 10). (h) Pdgfrb-lineage labeling in ingWAT (no WA labeling). (i) Zero adipocyte index for mosaic Pdgfrb WAT (n = 6). (j) Pdgfrb-lineage labeling in iBAT (no BA labeling). (i) Zero adipocyte index for mosaic Pdgfrb iBAT (n = 6). (b,c,e,g,i,k) Blue represents male and red represents female. All Scale bars: 100μm.
Histological controls for mosaic WAT/BAT and antibody stains for PDGFRa/PDGFRb are shown in Supplementary Fig. 5.

