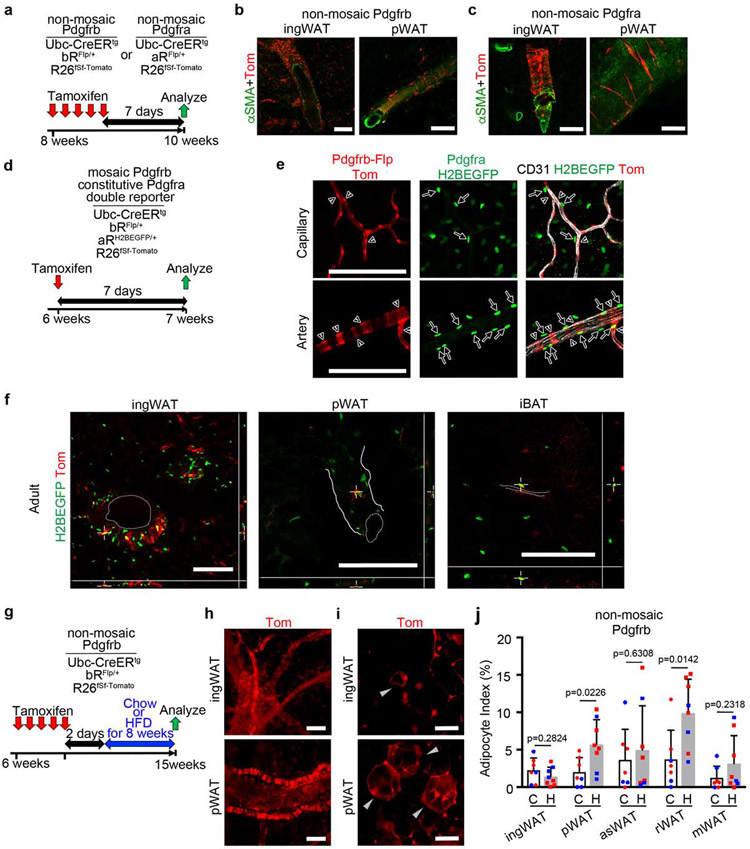
Figure 3. PDGFRα and PDGFRβ are expressed in the vascular adventitia under non-mosaic labeling conditions.
(a) Non-mosaic Pdgfra and Pdgfrb genotypes and experimental scheme for labeling at 8-weeks old with 5x Tmx (100mg/kg) and analysis after 7 more days. (b and c) Thick section WAT with Tomato labeling of adventitial fibroblasts and αSMA immunofluorescence of VSMCs. Representative of 1 male and 3 females (Pdgfrb) or 5 males and 6 females (Pdgfra). (d) Double reporter genotypes and experimental scheme for labeling at 6-weeks old with 1x Tmx (100mg/kg) and analysis after 7 days. (e) Thick section capillary or artery with Pdgfrb-lineage labeling (mural cells, red), PDGFRα+ nuclei (green), and CD31 immunofluorescence (endothelial cells, white). Some GFP+ cells are adjacent to blood vessels (arrows), but they are not co-labeled with Tomato+ (arrowheads). Representative of 4 mice. (f) Confocal z-stack of rare adventitial fibroblasts co-labeled with PDGFRα-H2BGFP and Pdgfrb-lineage/Tomato. Dotted lines indicate vessel lumens and solid lines indicate perivascular outline. Representative of 3 male and 1 female. See also Supplementary Videos 1-3. (g) Non-mosaic Pdgfrb genotypes and experimental scheme for labeling at 6-weeks old with 5x Tmx (100mg/kg) and analysis after 8 weeks of chow diet or HFD feeding. (h-i) Whole mount WAT with non-mosaic Pdgfrb-lineage/Tomato labeling of (h) adventitial fibroblasts or (i) adipocytes (gray arrowheads). (j) Adipocyte index + SD for non-mosaic Pdgfrb WAT after 8 weeks of chow diet (C) or HFD (H) (n = 7-8 mice). Blue represents male and red represents female. HFD differences are significant for pWAT and rWAT. All Scale bars: 100μm.
Additional data for HFD are shown in Supplementary Fig. 6.

