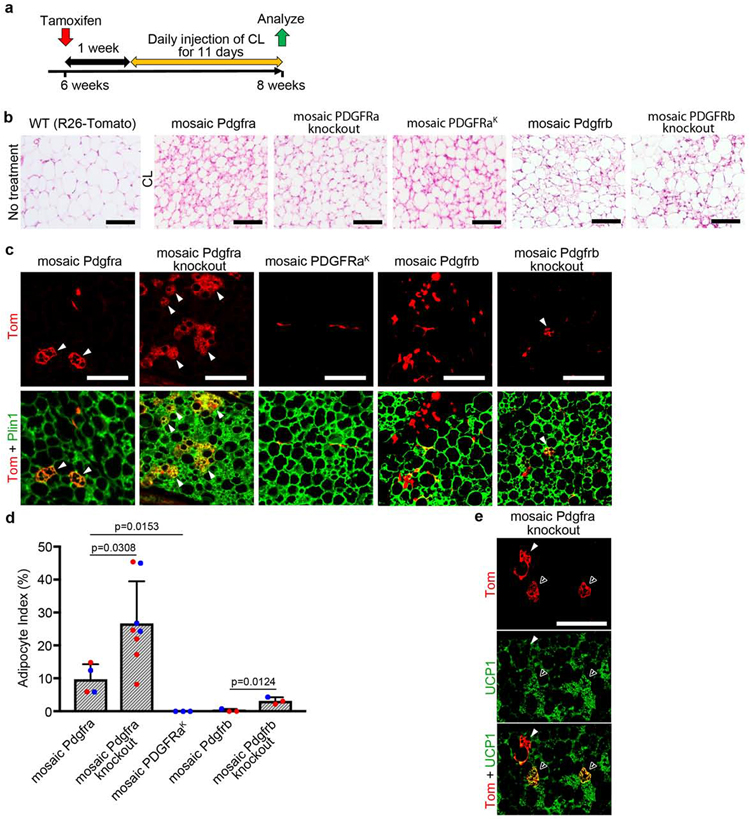
Figure 7. Mosaic inactivation of Pdgfra/Pdgfrb increases beige adipogenesis.
(a) Experimental scheme for labeling at 6 weeks with 1x Tmx, 1-week chase, 11 days of treatment with CL-316,243 (CL), and analysis at about 8 weeks. (b) H&E-stained pWAT without CL treatment, or different mosaic pWAT after 11-days CL showing browning response to Adrb3 activation. (c) Mosaic pWAT after CL treatment showing multilocular Tomato+ beige adipocytes (bA) with Plin1 (arrowheads). Immunofluorescence on paraffin. (d) Beige adipocyte index + SD for mosaic pWAT after CL, which is the number of Tomato+ bA divided by the total number of Tomato+ cells counted (bA + WA + stromal) (n = 3-8). Blue represents male and red represents female. (e) Mosaic Pdgfra knockout pWAT after CL treatment, showing multilocular Tomato+ bA with Ucp1 (open arrowhead) or without Ucp1 (filled arrowhead). All scale bars: 100μm.

