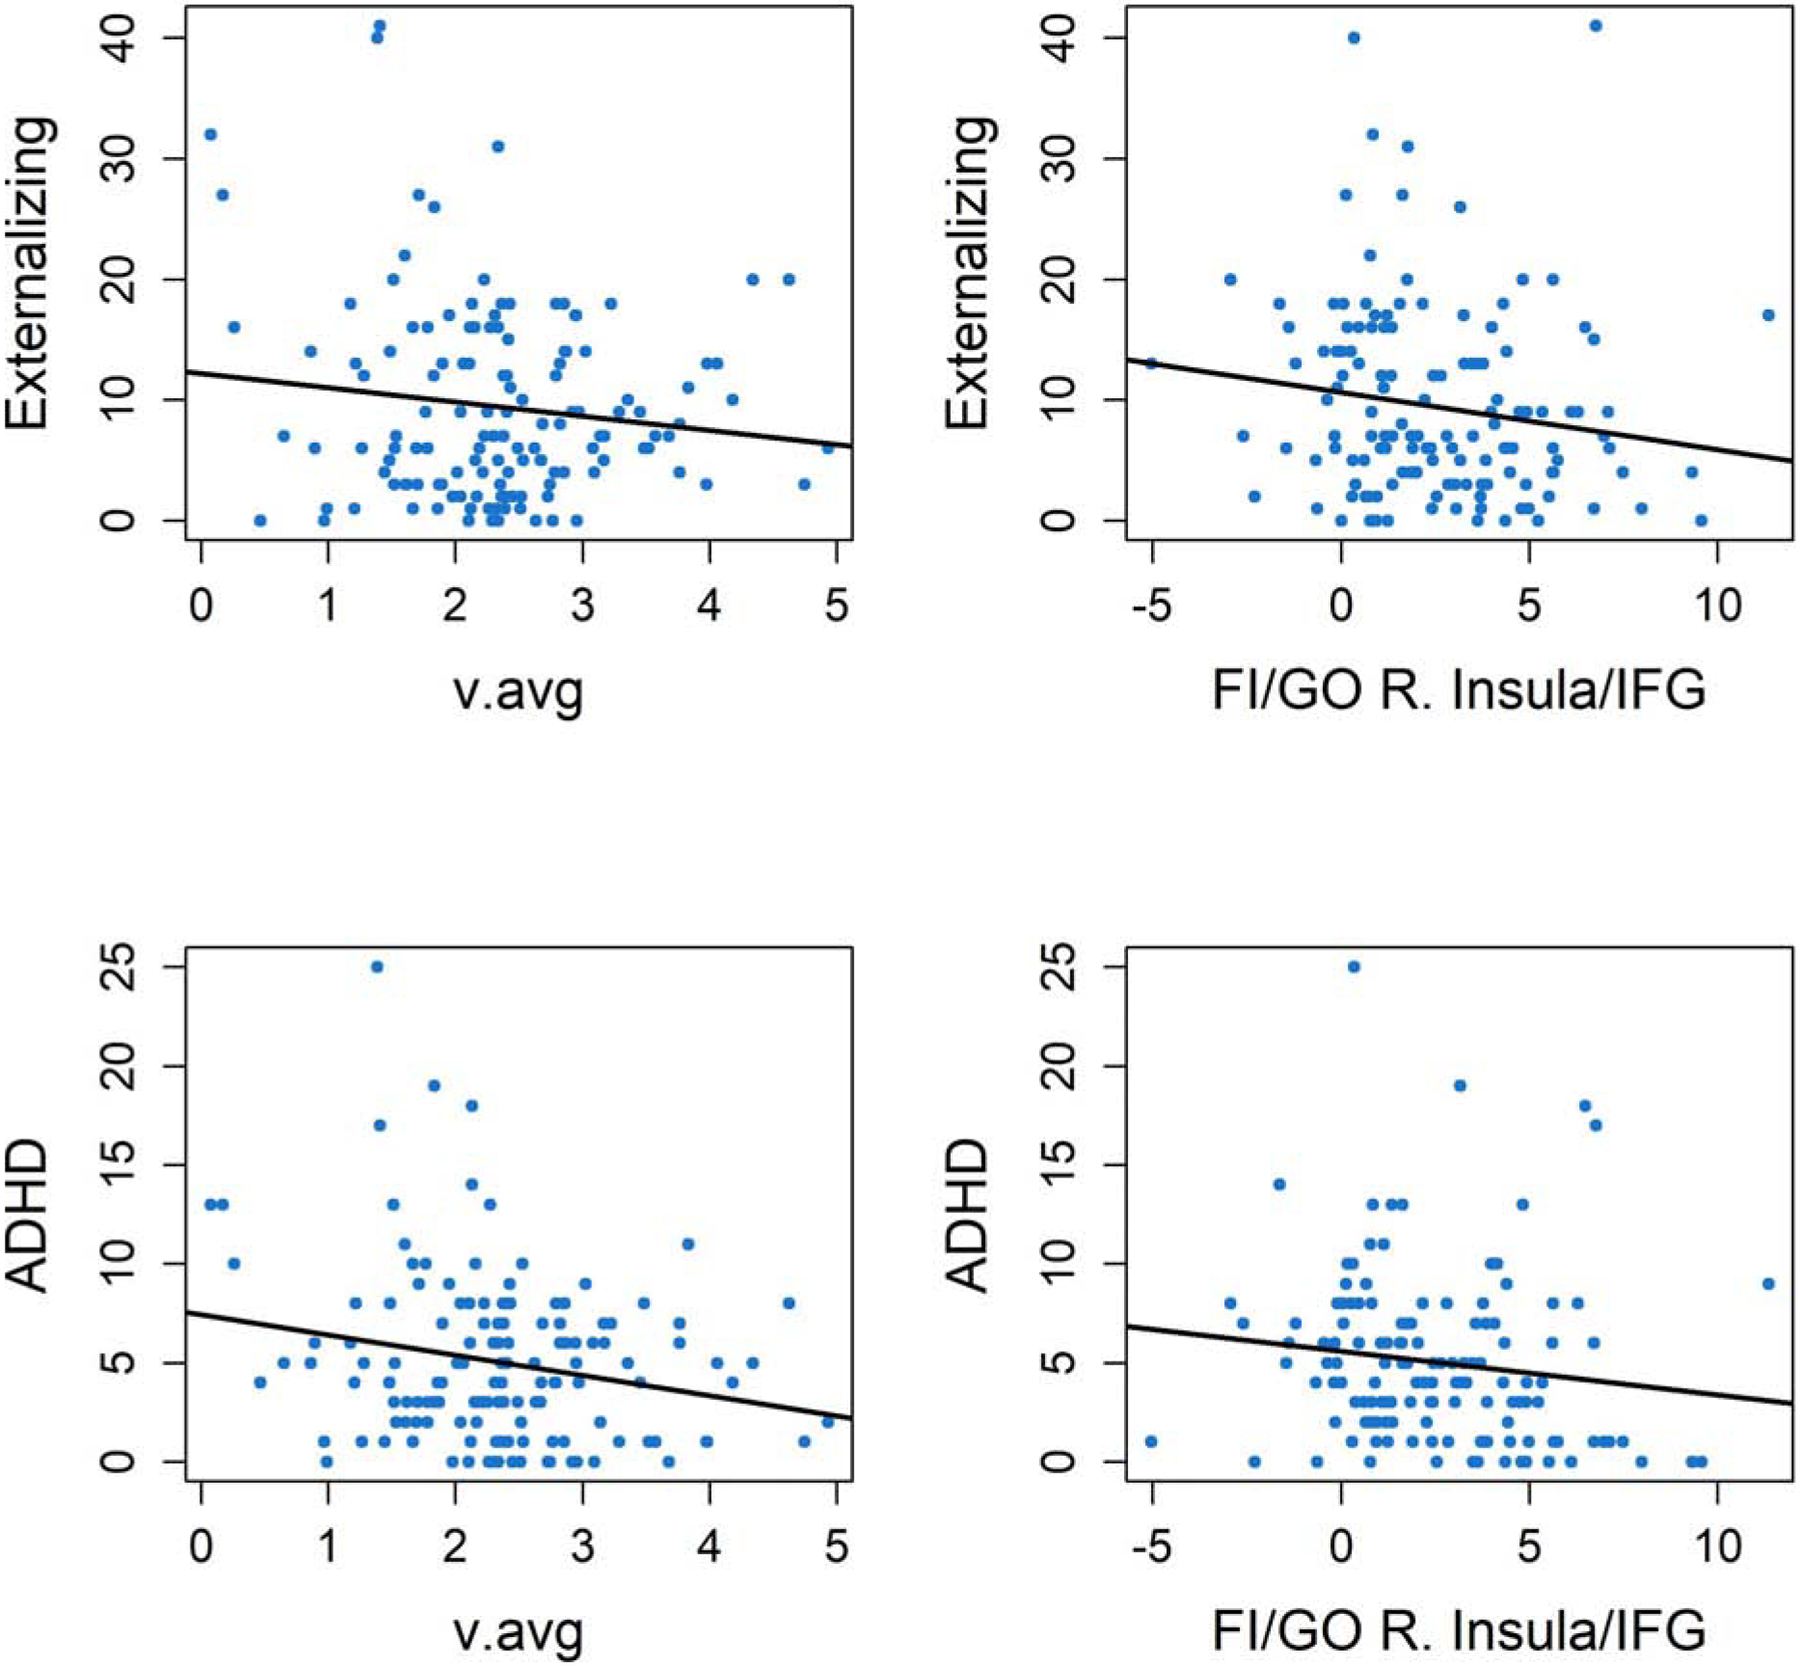
Figure 3.

Scatterplots of DDM parameters and neural correlates of DDM parameters which displayed evidence of correlational relationships with psychopathology ratings, including average drift rates (left panels) and FI>GO activations in the right insula/inferior frontal gyrus (IFG) (right panels). Plots display their relationships with raw scores of the DSM-ADHD and externalizing behavior subscales from the ASR, as well as regression lines for these relationships. For histograms of T-scores from these clinical measures, which demonstrate the range of severity in symptoms relative to clinical norms, see Supplemental Figure 6.
