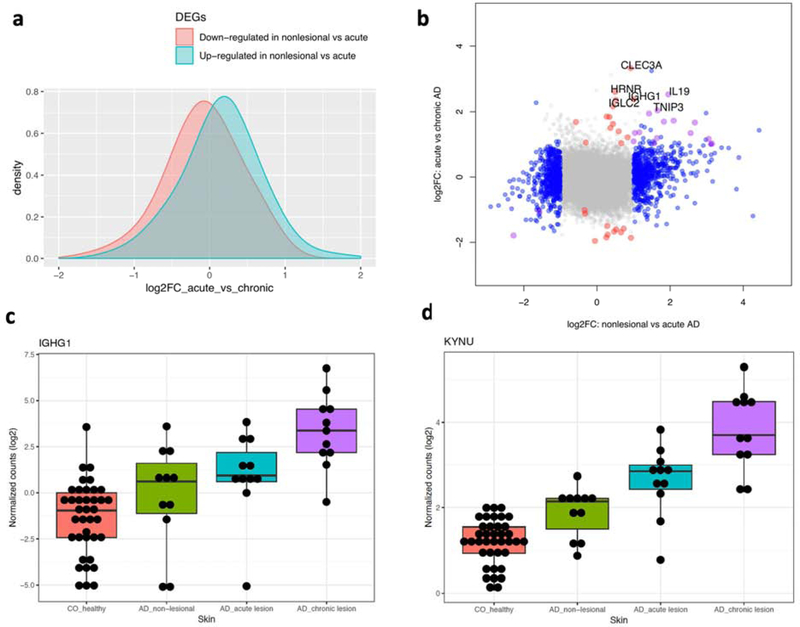
Figure 2. Molecular profiling for AD progression from acute to chronic.
a) effect size in the acute vs chronic AD comparison for genes dysregulated in non-lesional vs. acute AD; b) effect size comparison between non-lesional vs. acute AD (x-axis) against acute AD vs. chronic AD (y-axis). Genes are colored if they are dysregulated in the first (blue), second (red) or both comparisons (purple); c-d) boxplots to illustrate the expression profiles for 2 genes dysregulated in the acute vs. chronic comparison but not in the non-lesional vs. acute comparison.

