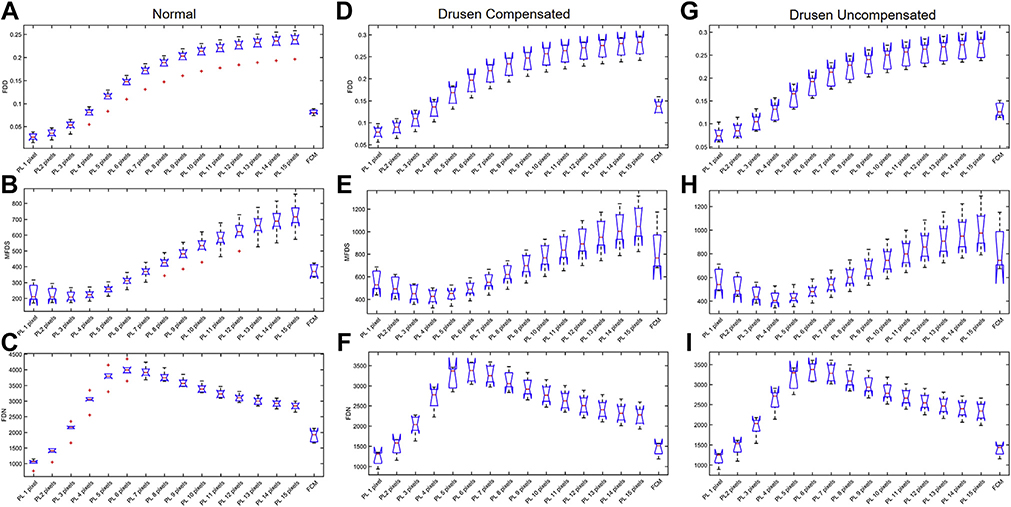
FIGURE 10.
Comparison of different choriocapillaris (CC) measurements obtained by using different thresholding techniques on a 3×3 mm scan obtained from normal eyes and eyes with drusen with and without compensation. In each plot, the results from the Phansalkar local thresholding method (PL) using a range of window radii from 1 to 15 pixels are compared with the fuzzy C-means (FCM) method. The box plots correspond to flow deficit densities (FDDs) (A, D, and G), mean flow deficit sizes (MFDSs) (B, E, and H), and flow deficit numbers (FDNs) (C, F, and I) from 6×6 mm scans using different thresholding techniques in normal subjects (A through C), drusen subjects with compensation (D through F), and drusen subjects without compensation (G through I).

