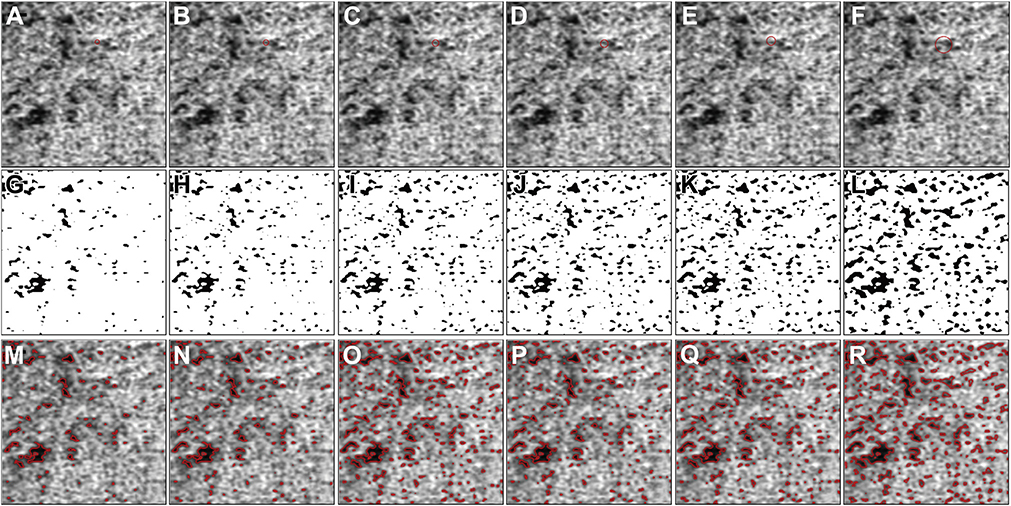
FIGURE 12.
The effect of choosing different window radii in the Phansalkar local thresholding method for 3×3 mm choriocapillaris (CC) swept source optical coherence tomography angiography (SS-OCTA) images. (A through F) Cropped 3×3 mm CC OCTA image with red circles representing a local window with radii of 4, 5, 6, 7, 8, and 15 pixels, which correspond to circles with 26.37 μm, 32.23 μm, 38.09 μm, 43.95 μm, 49.80 μm, and 90.82 μm diameters. (G through L) Corresponding binarized CC images with a local window radius of 4, 5, 6, 7, 8, and 15 pixels, which correspond to circles with 26.37 μm, 32.23 μm, 38.09 μm, 43.95 μm, 49.80 μm, and 90.82 μm diameters. (M through R) The overlay of detected CC FDs from parts G through K represented as red lines on the corresponding SS-OCTA CC images from parts A through F. Scale bar = 100 μm.

