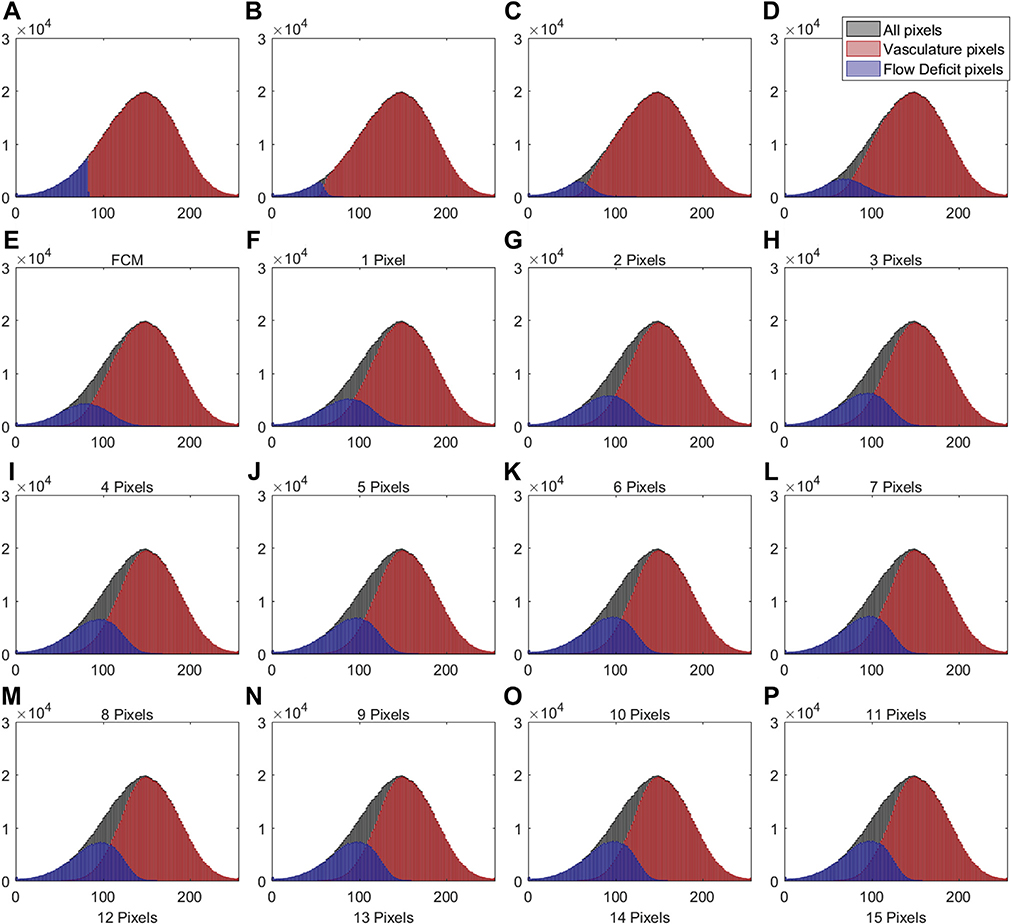
FIGURE 8.
Histogram plots of different groups of pixels corresponding to the 6×6 mm choriocapillaris images shown in Figures 6 and 7. (A) Histogram of different groups of pixels using the fuzzy C-means method. (B through P) Histograms of different groups of pixels using the Phansalkar local thresholding method with window radii ranging from 1 to 15 pixels. As in Figure 1, part F, the black color represents all pixels from the compensated swept source optical coherence tomography angiography choriocapillaris (CC) image, the red color represents the vasculature pixels corresponding to the CC, and the blue color represents the pixels corresponding to the CC flow deficits.

