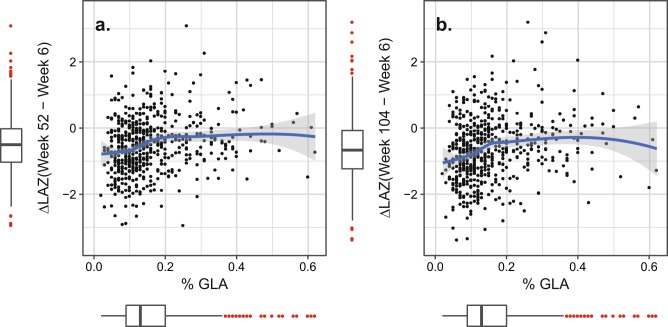
Fig. 2.
Plots of the unadjusted primary and secondary outcomes, ΔLAZ (week 52–week 6) and ΔLAZ (week 104–week 6) against the percentage of gamma-linolenic acid (%GLA) in breast milk in the PROVIDE study Bangladeshi families. The blue line is the nonlinear local mean at each value of %GLA fitted by loess algorithm, and the gray envelope is the 95% confidence envelope. Red points in surrounding box plots indicate points outside the range [median – 1.5 × interquartile range, median + 1.5 × interquartile range]. LAZ length for age Z score. To magnify the change of interest, the y-axis range of the plots omits one extreme outlier infant point at ΔLAZ(week 52−week 6) = −5.19, %GLA = 0.04; and the same infant ΔLAZ(week 104 − week 6) = −4.49, %GLA = 0.04

