
Fig. 1.
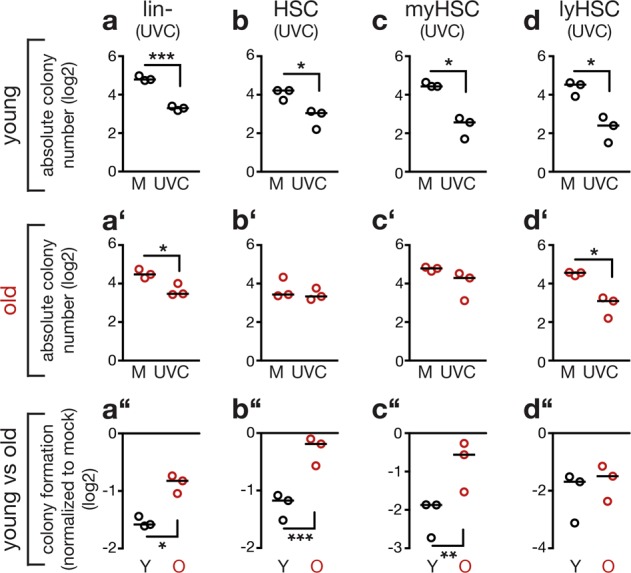
Aging alleviates suppression of colony formation of hematopoietic stem and progenitor cells in response to bulky DNA adduct induction. The scatter plots depict the capacity of the indicated types of hematopoietic stem and progenitor cells from young and old mice to form colonies in response to UVC. All cells were freshly isolated, left untreated or irradiated with 7.5 J/m2 UVC and growth of colonies was assessed 10 to 14 days later. Shown are (a to d’) absolute numbers of formed colonies as well as the (a” to d”) comparison of colony number between control and treated cells isolated from individual mice. Individual data points represent results obtained with cells isolated from individual mice (biological replicates). Data were log-transformed to obtain normal distribution. Black lines: median. Two-tailed unpaired Welch’s t-test (a to d’) and two-tailed paired t-test (a” to d”). a, a’, a” Lineage-negative (Lin-) cells from three young and three old mice; p = 0.0001 (a); p = 0.0229 (a’); p = 0.0112 (a”). b, b’, b” Long-term (LT) HSCs from three young and three old mice; p = 0.0322 (b); p = 0.0002 (b”). c, c’, c” Myeloid (my)-biased HSCs from three young and three old mice; p = 0.0185 (c); p = 0.0077 (c”). d, d’, d” Lymphoid (ly)-biased HSCs from three young and three old mice; p = 0.0162 (d); p = 0.0336 (d’)