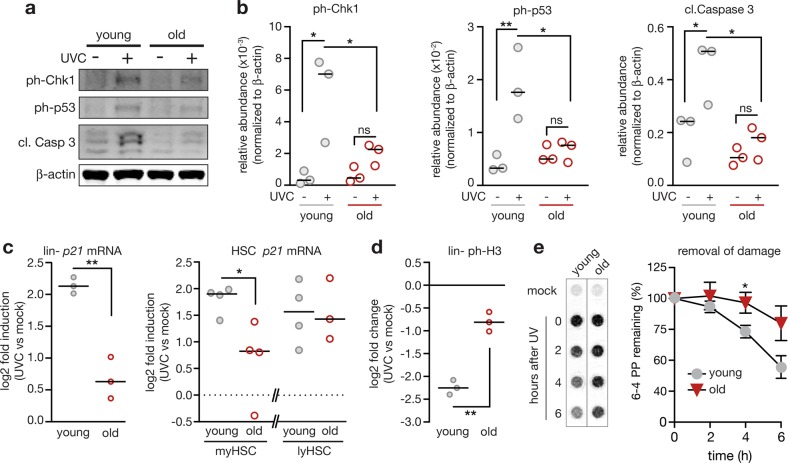
Fig. 2.
Hematopoietic stem and progenitor cells from aged mice exhibit intrinsic impairments in DNA damage responses (DDRs), delayed DNA repair, and DNA damage-resistant cell cycle activity. a–c Checkpoint responses were analyzed in lineage-negative (Lin-) cells and HSCs from young and old mice. Cells were freshly isolated and immediately irradiated with 10 J/m2 UVC ( + UVC) or left untreated (-UVC) and lysed 5 h later. a, b Western blot analysis revealed reduced activation of Chk1 (phosphorylation at serine 345) and p53 (phosphorylation at serine 15) as well as attenuated cleavage of caspase 3. Cells of individual mice (three young and old) were lysed and analyzed separately on the same membrane. a Representative western blot. Scans of whole membranes are shown in Supplemental Fig. 3. All antigens were detected on one membrane from the identical transfer. b Signals were quantified after normalization to β-actin. Two-way ANOVA with Holm-Sidak correction. Young mock vs. UVC p = 0.0111 (ph-Chk1), p = 0.0076 (ph-p53), p = 0.0236 (cl. Casp. 3); UVC young vs old p = 0.0470 (ph-Chk1), p = 0.0164 (ph-p53), p = 0.0169 (cl. Casp. 3). Bar indicates the median. c The histograms show the qPCR analysis of p21 mRNA levels normalized to Hmbs (Lin- cells) or Polr2a (HSCs) in freshly isolated Lin- cells (n = 3), myeloid-biased HSCs (n = 4) and lymphoid-biased HSCs (n = 4 and 3) from aged mice compared to young control mice. Lysates of cells from individual mice were analyzed separately and are depicted as data points (circles). Fold induction levels of p21 mRNA were calculated by comparing irradiated vs. mock-treated cells from the same mouse. Black bars represent median. Data was log transformed. Two-tailed Welch’s test: Lin- cells: p = 0.0087; myHSCs: p = 0.0486. d Freshly isolated Lin- cells were left untreated or irradiated with 10 J/m2 UVC, fixed 5 h later, and probed for levels of phospho-Histone H3 (ph-H3) as measure for mitotic cells. Cells of individual mice were analyzed separately. Three mice per age group were analyzed. Circles reflect data obtained from individual mice. Fold changes of ph-H3 levels were calculated by comparing levels of irradiated with mock-treated cells that were isolated from the same mouse. To obtain normal distribution, data was log transformed. Two-tailed Welch’s test: p = 0.001. Bar indicates the median e Bulky DNA adducts, specifically 6–4 photoproducts (6–4 PP), were measured at indicated time points after UV-irradiation (20 J/m2 UVC) or control treatment. Freshly isolated, Lin- cells from 2-month or 24-month-old mice were employed (n = 4 mice per group); two-tailed, Welch’s t-test, young vs. old, 4 h p = 0.0460, 6 h p = 0.0513. The depicted signal intensities are derived from the same membrane (Supplemental Fig. 3). Mean ± SEM

