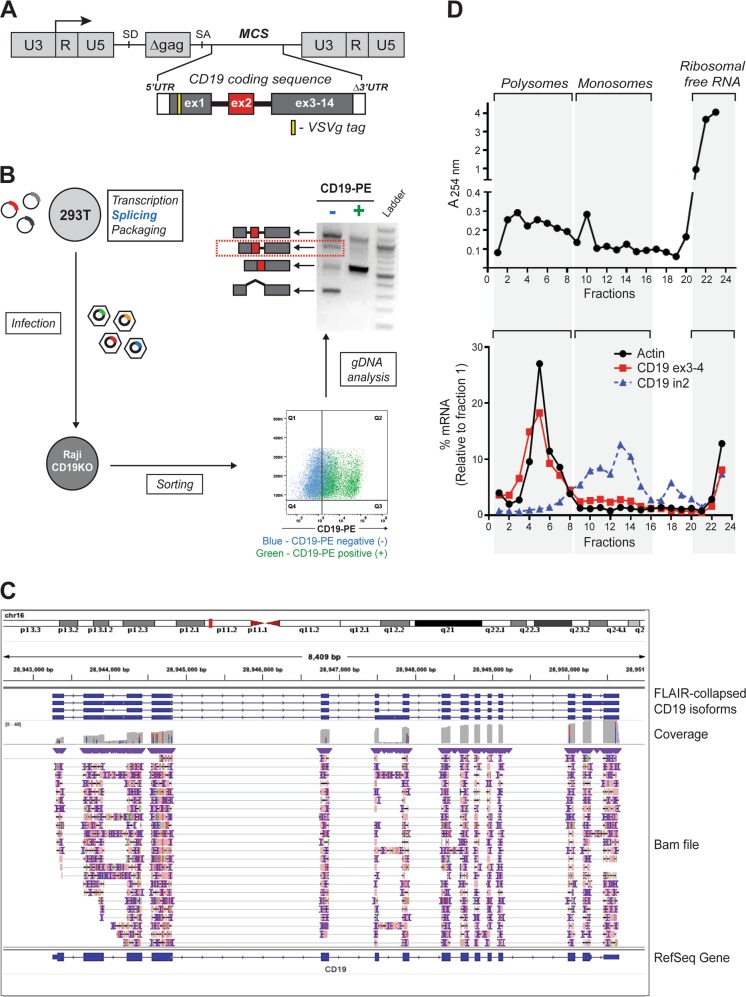
Fig. 1.
Robust retention of intron 2 limits CD19 protein expression. a Schematic representation of the retroviral construct containing N-terminal VSVg-tagged CD19 coding sequence including the two introns flanking exon 2. U3, R, and U5 form the retroviral long terminal repeats (LTR); SD and SA denote 5′ (“donor”) and 3’ (“acceptor”) splice sites, respectively; MCS denotes the multiple cloning site. b Splicing of the retrovirally encoded CD19 transcript. The CD19 retroviral cassette was transfected into 293T cells, transcribed, spliced, and packaged into viral particles, which were used to infect a CD19-null derivative of the Raji B-cell line. The transduced Raji cells were sorted into CD19-positive and negative populations after gating based on the parental cell line. The splicing pattern of CD19 exon 2 was analyzed by genomic DNA PCR using the VSVg-specific forward primer to prevent amplification of the endogenous CD19 locus. The identity of all PCR products was confirmed by Sanger sequencing. c Long-read RNA-Seq analysis of the endogenous CD19 transcript using the Oxford Nanopore Technology (ONT). The library was prepared from 1 µg of poly(A)-enriched mRNA from REH B-ALL cells using Direct RNA sequencing kit (SQK-RNA002). It was loaded onto a R9.4 flow cell and sequenced on the MinION device FLO-MIN106D for 48 h. The fast5 files were processed using the Guppy algorithm (v3.2.2). Alignment to the human genome (hg19) was achieved using minimap2 (v2.17-r941). The FLAIR package (v1.4) was used to create a collapsed view of the different CD19 isoforms. The structure of the CD19 transcript was visualized using Integrative Genomic Viewer (IGV). The corresponding fastq file has been deposited in GEO under accession number GSE136068. d Profiling of ribosomes on the endogenous CD19 transcript. The whole cell lysate was prepared by incubating 2 × 10⁷ REH cells in lysis buffer supplemented with 100 µg/ml cycloheximide. It was layered onto a 10-50% sucrose density gradient, subjected to centrifugation at 35,000 rpm for 3 h, and fractionated into twenty four 0.5-ml fractions. The top panel shows the ribosomal content measured at 254 nm. The bottom panel shows the relative distribution of specific transcripts across the gradient calculated using the formula 2Ct (fraction 1-X) X 100/sum

