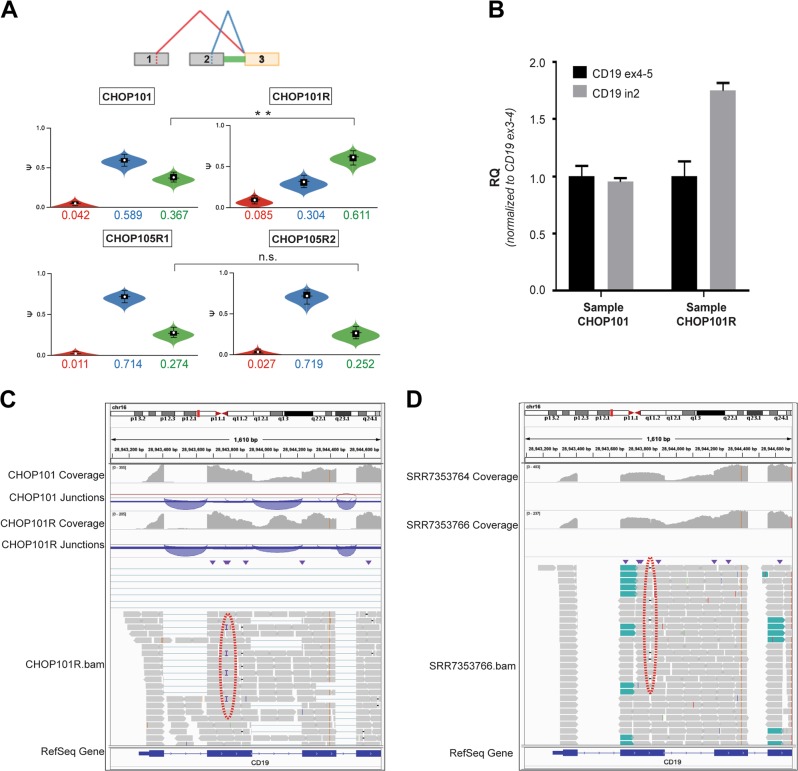
Fig. 2.
Contribution of CD19 intron 2 retention to resistance to CART-19. a MAJIQ output for screening samples CHOP101 and CHOP105R1 compared with relapse samples CHOP101R and CHOP105R2 (top and bottom, respectively). The diagram at the top represents key splicing events. The color-matched violin plots represent the abundance of individual splice isoforms. Double asterisk denote the 0.99 probability of at least 5% difference in percent-spliced-in values (∆psi). b RT-qPCR analysis of CD19 intron 2 retention in CHOP101 and CHOP101R samples using oligonucleotides that span constitutive exon/exon junctions (ex4–5 and ex3–4) and a cassette exon/intron junction (ex2-in2). The RQ values were normalized for CD19 expression levels measured using ex3–4 primers, as described previously by Sotillo et al. c IGV visualization of CD19 transcripts in CHOP101 and CHOP101R samples using as sources untrimmed bam files. Coverage tracks show read coverage for a given gene segment. Junction tracks summarize reads spanning junctions denoted by arches. The red dotted oval denotes the subclonal frameshift insertion. d IGV visualization of CD19 transcripts in 5S and 5R samples using as sources trimmed bam files deposited in the Short Reads Archive as SRR7353764 and SRR7353766. The red dotted oval denotes the subclonal frameshift mutation. Other designations are as in c

