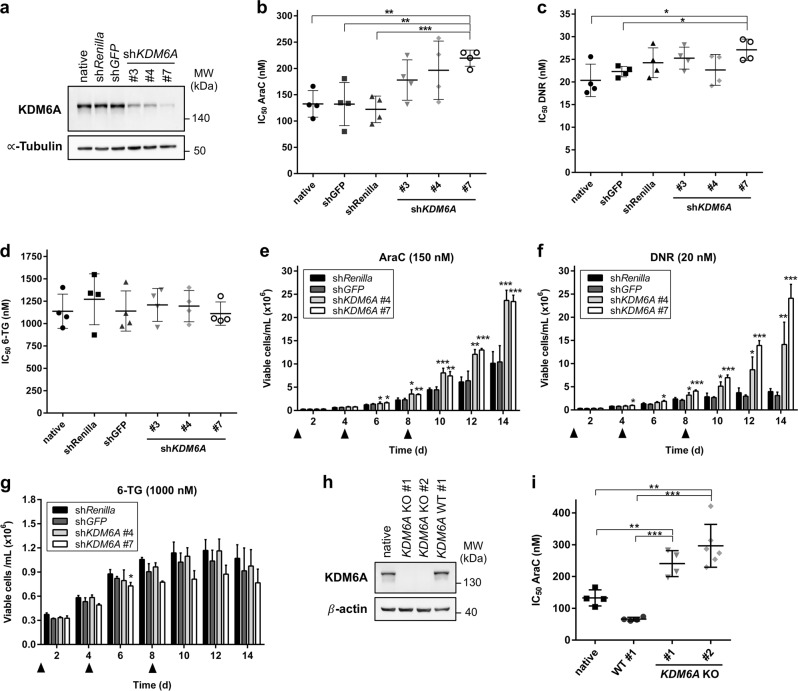
Fig. 4.
Reduction or loss of KDM6A expression confers decreased AraC and DNR sensitivity in K562 cells. a Immunoblot showing knockdown (KD) of KDM6A expression in K562 cells lentiviral transduced with three different shRNAs against KDM6A. shRenilla and shGFP serve as controls. Blot is representative of three independent experiments. MW molecular weight, α-Tubulin loading control. b–d Comparison of IC50 values for AraC (b), DNR (c), and 6-TG (d) between control and KDM6A KD in K562 cells. Cells were treated for 72 h with the respective drug. Mean of IC50 values from four independent experiments ± s.d. are shown. Unpaired, two-tailed Student’s t-test; *P < 0.05; **P < 0.01; ***P < 0.001. e–g Long-term proliferation assay measuring the amount of viable K562 cells, shControl and shKDM6A, every 2 days for 14 days in total. Cells were treated with 150 nM AraC (e), 20 nM DNR (f), or 1000 nM 6-TG (g) on Day 0, 4, and 8 as indicated with the triangle. Mean ± s.d. are given for three independent experiments. Unpaired, two-tailed Student’s t-test; *P < 0.05; **P < 0.01; ***P < 0.001. h, Immunoblot showing loss of KDM6A protein in KDM6A knockout (KO) K562 cells. Results of one representative experiment are shown (n = 3 experiments). MW molecular weight, β-actin loading control. i Increase in AraC IC50 values in both KDM6A KO K562 clones compared to WT #1 clone or native cells. Mean of IC50 values ± s.d. from at least four independent experiments are shown. Unpaired, two-tailed Student’s t-test; **P < 0.01; ***P < 0.001

