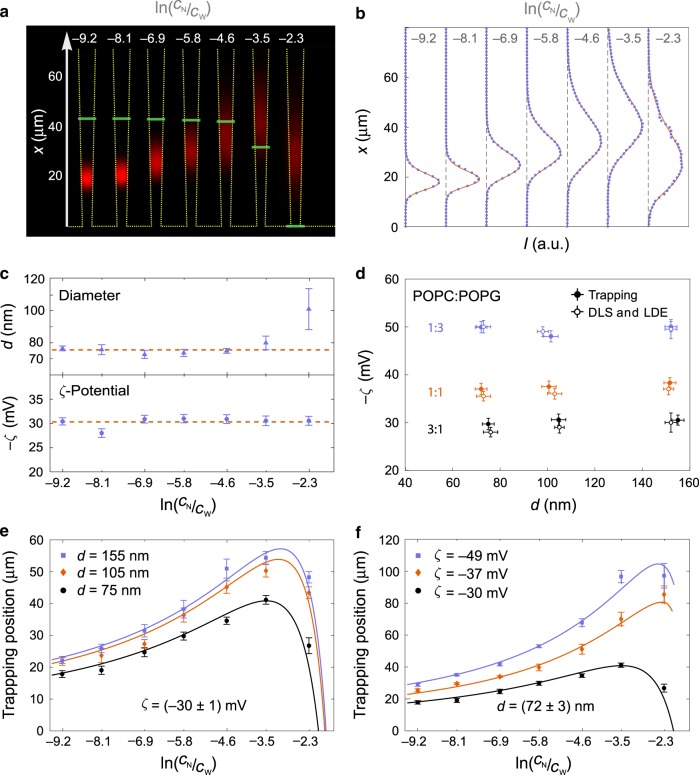
Fig. 3. Trapping of different types of liposomes in nanochannels.
a Composite fluorescence microscope image of trapped POPC:POPG 3:1 liposomes in nanochannels (outlined with yellow) measured at seven different salinity gradients (CN in the range 10−3× PBS to 1× PBS and CW fixed at 10× PBS). Liposomes have diameters dDLS = (76 ± 3) nm and zeta potentials ζLDE = (−28 ± 1) mV. Green, horizontal lines mark the positions of physiological salinity (1× PBS). The images were averaged over 10 s. b Fluorescence intensity along the nanochannel (blue dots) and corresponding fits (red line). c Extracted liposome diameter and zeta potential of the same liposomes at different salinity gradients. Dashed, red lines are weighted averages over the fit parameters for the different salinity gradients. d Summary of results for diameters and zeta potentials obtained from trapping, DLS, and LDE experiments for the nine different combinations of zeta potentials and diameters. Each trapping data measurement is obtained similarly as the average values shown in c. e Trapping positions of POPC:POPG 3:1 liposome populations with three different sizes and an average zeta potential of (−30 ± 1) mV. Solid lines are the theoretical trapping positions with the corresponding values from the trapping method in d as input parameters and an independent calibration of the fluid flow. f Trapping position of liposomes with three different compositions, and, consequently, zeta potentials, but almost identical sizes [average diameter (72 ± 3) nm]. Solid lines are the theoretically predicted trapping positions calculated as in e. All error bars are the standard errors on the means (n = 3).

