
Fig. 4. Separating a mixture of liposomes.
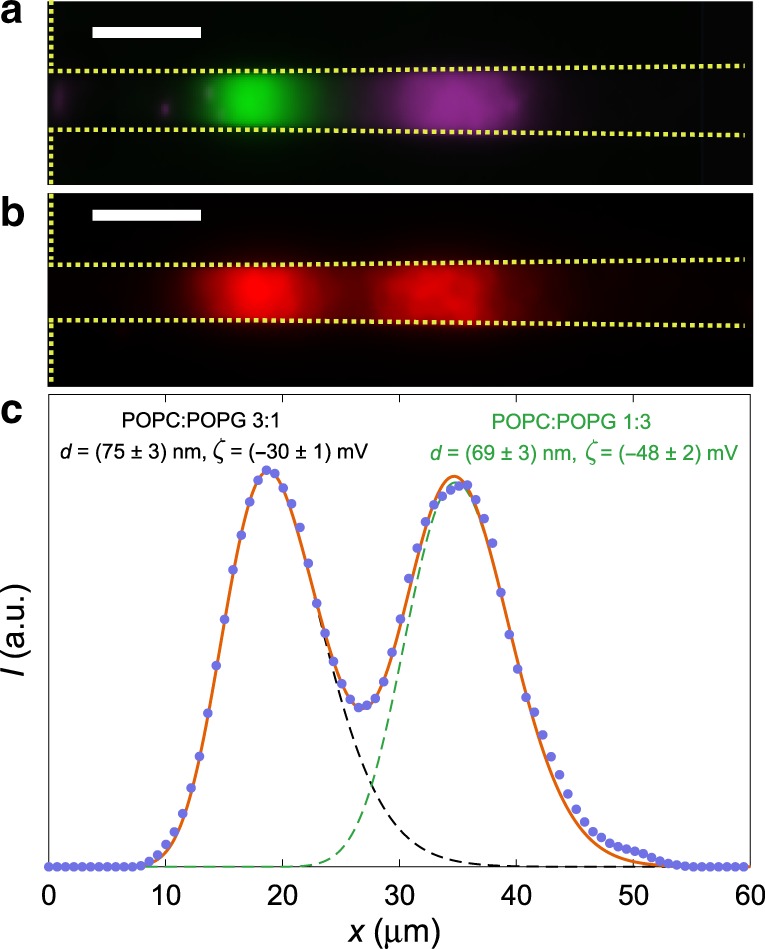
a Fluorescence image of trapped POPC:POPG 3:1 and POPC:POPG 1:3 liposomes marked with different fluorophores in a nanochannel (outlined with yellow). Experiment is performed at ln(CN/CW) =− 8.1. Scale bar is 10 μm. b Same as a, but for liposomes with identical fluorophores. The image is an average over 10 s. Scale bar is 10 μm. c Fluorescence intensity of the two trapped populations shown in b (blue dots) and corresponding fit (red line) of the full distribution describing two particle populations, Cp(x) = w1Cp,1(x) + w2Cp,2(x). Here Cp,1 and Cp,2 are the fits to Eq. (7) for the two particle populations, and w1 and w2 are weight factors with w1 + w2 = 1.