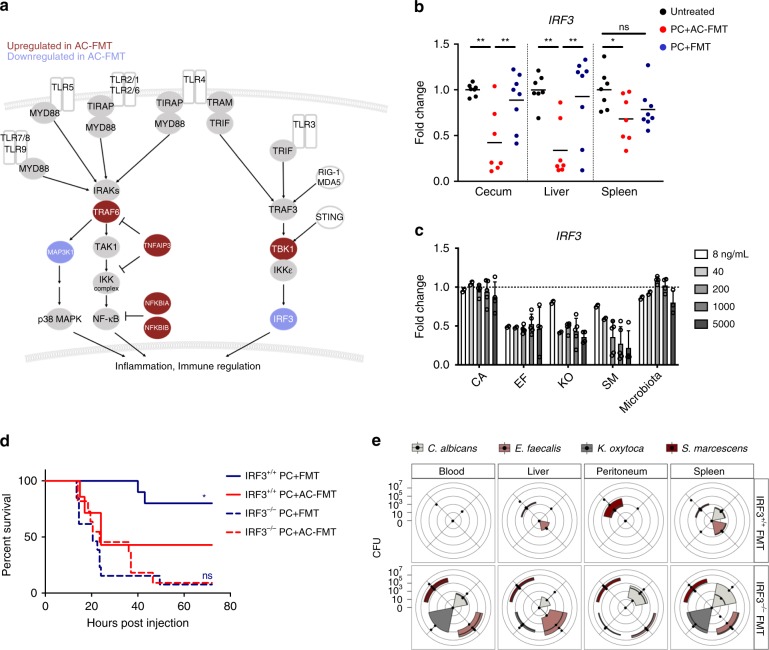
Fig. 3. Clearance of systemically disseminated pathogens by FMT requires intact IRF3.
a Summary of transcriptional changes in the NF-κB/IRF3 signaling pathway downstream of various pattern recognition receptors in the cecum, liver, and spleen of PC + Surgery + AC-FMT mice on POD2. Red shaded circles are genes that are significantly upregulated, blue shaded circles are genes that are significantly downregulated. b Mice were injected i.p. with PC and treated with FMT or AC-FMT as before. RNA was isolated from indicated organs ~20 h post injection of PC and qPCR for IRF3 was performed. (Fold change compared with the mean of untreated group IRF3 relative expression for each organ; n = 7, 7, and 8 for untreated, PC + AC-FMT, and PC + FMT-treated mice, respectively; center is mean; one-way ANOVA/Tukey’s multiple comparison; *P ≤ 0.05, **P ≤ 0.01). c MEFs were cultured for 12 h in culture media containing filtered lysates made from cultured individual PC members, or from cecal contents of untreated mice at the indicated concentrations. MEF RNA was isolated and IRF3 expression was measured by qPCR. (Fold change compared with the baseline of untreated MEF IRF3 relative expression [highlighted with the dotted line at y = 1] shown; 3 independent experiments; n ≥ 3 for all conditions; mean + SD). d, e To assess the requirement for IRF3 in FMT-mediated protection, IRF3+/+ and IRF3−/− littermates were injected i.p. with PC and treated with FMT or AC-FMT as before. d Kaplan–Meier survival curves for genotypes and treatments indicated (n = 10, 7, 13, and 11 for IRF3+/+ mice with PC + FMT, IRF3+/+ mice with PC + AC-FMT, IRF3−/− mice with PC + FMT, and IRF3−/− mice with PC + AC-FMT, respectively; Log-rank (Mantel–Cox) test; P = 0.0469 between IRF3+/+ PC + FMT/IRF3+/+ PC + AC-FMT, P = 0.5440 between IRF3−/− PC + FMT/IRF3−/− PC + AC-FMT). e Quantitative culture results of indicated sites comparing the PC burden of PC + FMT-treated IRF3+/+ and IRF3−/− mice ~20 h post injection of PC. On radar plot, each dot along the axes represents the CFU/mL of blood and peritoneal fluid or CFU/mg of liver and spleen of one mouse, the further the distance from the center of the plot, the higher the pathogen burden. The third and first quartiles and the median are indicated with the edges of the colored boxes and the thick black line respectively (n = 5 mice/group; Mann–Whitney test; PC burden significantly different between IRF3+/+ PC + FMT/IRF3−/− PC + FMT in the blood [EF*, SM*], liver [EF*, KO*, SM**], peritoneum [CA*, KO*, SM*], and spleen [EF*, KO*]. *P ≤ 0.05, **P ≤ 0.01).

