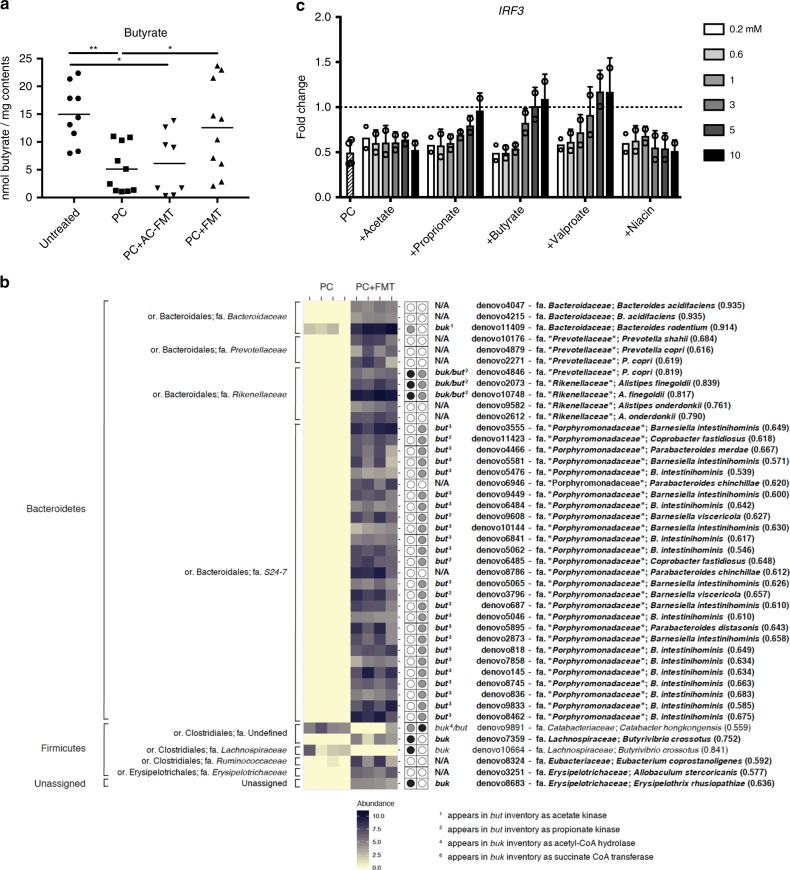
Fig. 4. Pathogen infection drives butyrate deficiency and butyrate can restore IRF3 in vitro.
a Mice were injected IP with PC and treated with FMT or AC-FMT as before. Cecal contents were collected ~20 h post injection of PC and butyrate levels were measured by GC–MS. (One-way ANOVA/Tukey’s multiple comparison, *P ≤ 0.05, **P ≤ 0.01). b Analysis of the OTUs found in the datasets reveals that FMT increases the presence and abundance of butyrate-producing bacteria. Changes in specific OTUs between mice treated with or without FMT were detected using the R packages phyloseq and DESeq262,63. The figure depicts significant log2-fold changes based on an FDR (Benjamini–Hochberg) significance threshold of 0.01 in the relative abundance of specific OTUs between PC and PC + FMT mice as heatmaps. Representative sequences for each of these OTUs were then used to search the Ribosomal Database Project’s set of quality-controlled, aligned, and annotated bacterial 16S rRNA sequences using SeqMatch36 in order to obtain nearest neighbor matches with cultured representatives at the genus-species level. On the left are the phylum and family classifications of the OTUs and on the right are the putative genus/species designation (numbers in parentheses indicate SeqMatch score [Sab]). The panel to the right of the heatmaps indicate whether butyrate kinase (buk) or butyryl-CoA:acetate CoA-transferase (but) encoding genes have been detected in the genomes of the SeqMatch genus/species assignments based on the buk and but entries in the RDP FunGene functional gene pipeline and repository64. A closed black circle indicates the presence of a buk or but gene in that genome, whereas a closed gray circle indicates an alternate annotation (defined at the bottom of the figure). An open circle indicates that no match was found in the RDP FunGene. Those listed in bold on the right are enriched in the PC + FMT mice. c MEFs were treated with of equal concentrations of filtered lysates from all four PC members (250 ng/mL) in the absence (striped) or presence of indicated amounts of compounds for 12 h. MEF RNA was isolated and qPCR was performed to measure the effect of PC members on IRF3 expression in vitro (fold change compared with the baseline of untreated MEF IRF3 relative expression [highlighted with the dotted line at y = 1] shown; three independent experiments; n ≥ 3 for all conditions; mean + SD).

