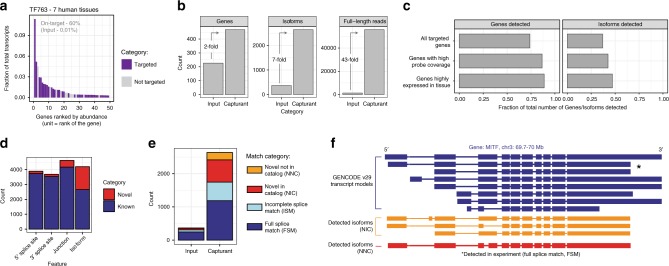
Fig. 4. Full-length transcription factor isoforms across diverse human tissues.
a Rank abundance bar plot for cDNA enriched for human TFs. Only the top 50 most abundantly expressed genes are shown. Each bar corresponds to a single gene, colored by whether that gene is targeted (purple) or not targeted (gray). Abundances as shown on the y-axis are computed by dividing the number of full-length reads mapped to the gene by the total number of full-length reads. On-target rates for input and capturant are shown. b Gains in coverage of target genes upon enrichment. Increases in number of genes, isoforms, and full-length reads are shown. Data used to generate these numbers used an equal number of full-length raw reads that were subsampled from the unenriched (input) or enriched (capturant) cDNA. c Fraction of all GENCODE genes and transcripts detected in the capturant. A gene is considered detected if at least one full-length read is detected for that locus. Isoforms are considered detected if the full set of junctions are identical between the GENCODE-annotated and sequenced transcript. The fraction detected was also computed for sets of genes for which there was higher probe set representation of the gene (1 TPM or higher) and genes for which there was evidence of expression in the tissues interrogated (10 TPM or higher). d Fraction of novel splice sites, junctions, and full-length isoforms in the TF enrichment experiment. Unique splice sites and junctions are only counted once. The 5′ splice site corresponds to the splice donor and the 3′ splice site corresponds to the splice acceptor. SS, splice site. e Proportions of known and novel isoforms. Known isoforms are further divided by completeness. Novel isoforms are further divided by whether all splice sites are found in GENCODE (novel in catalog, NIC) or if the isoform contains a novel splice site (novel not in catalog, NNC). Match categories are defined by the isoform annotation tool SQANTI. g Example of isoforms from the gene MITF identified from the TF763 capture experiment. Source data are available in the Source Data file.

