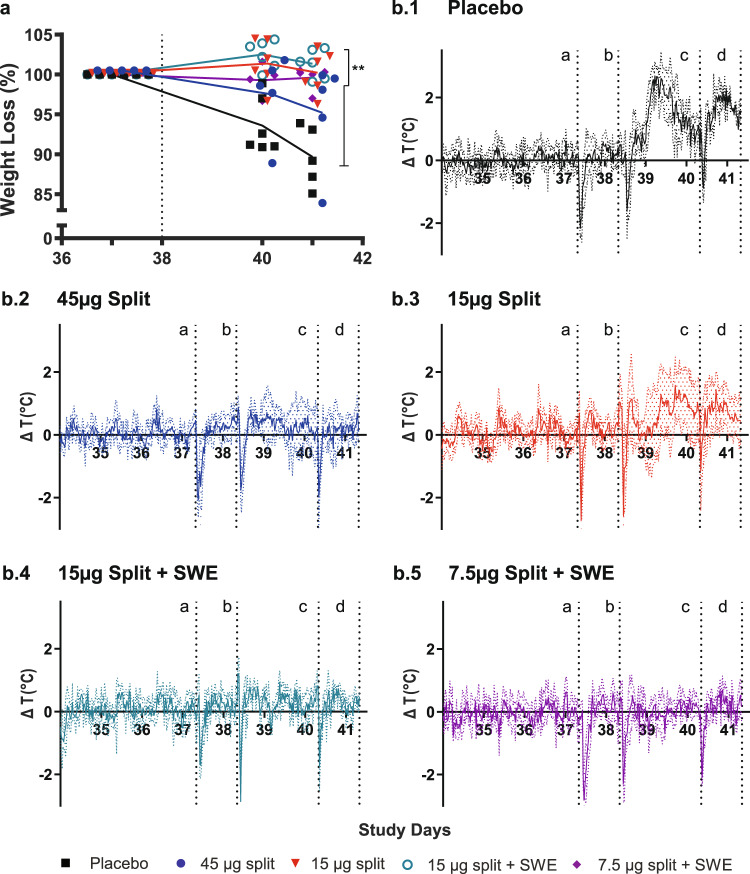
Fig. 3. Weight loss and fever.
Body weight prior to challenge was set at 100% and percentage weight loss was subtracted from baseline a. Presented are the individual data and lines connecting the averages: placebo (black squares), split vaccines alone (45 µg HA—blue circles, 15 µg HA—red triangles) or SWE-adjuvanted split vaccines (15 µg HA—green open circles, 7.5 µg HA—purple diamonds). Body temperature was recorded every 30 min by transponders that were placed in the intraperitoneal cavity. To analyze fever development, the temperature difference compared with baseline was calculated and the average ΔT per group was plotted. The colored dotted lines indicate the standard deviation. The several sharp decreases in temperature are a result of sedation required for sampling and challenge. Color coding is the same as for the body weight graph. b.1 placebo; b.2 45 µg split; b.3 15 µg split; b.4 15 µg split-SWE; b5 7.5 µg split-SWE. Vertical dotted lines indicate: a. challenge; b and c. swab collection; d. termination. WMW test: **p < 0.01.

