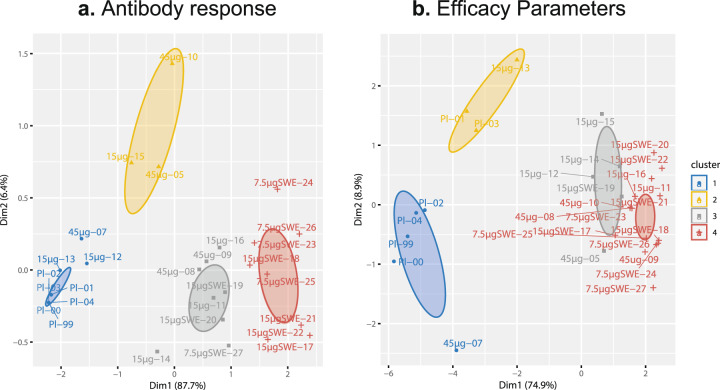
Fig. 9. Cluster analysis of the antibody response and efficacy measurements.
Cluster analysis using the partitioning around medoids (PAM) algorithm as a descriptive statistical approach to visualizer overall trends in the ferret study population. Subjects are plotted using a principal component analysis and clusters determined by PAM are indicated by ellipses. a Clustering of the antibody response based on the area under curve (AUC) of the log-transformed antibody titers from D0 until D37. b Clustering of the efficacy parameters based on assays with numerical data output including virus replication, weight, fever, and pathology parameters (excluding ordinal data). Labels indicate vaccine dose with or without adjuvant and animal number. Pl placebo.

