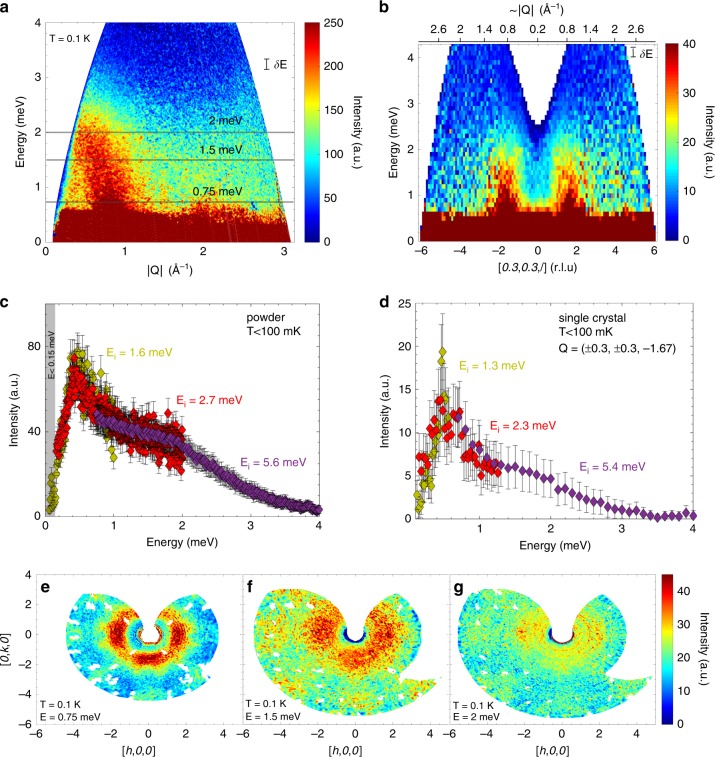
Fig. 3. Magnetic inelastic neutron scattering data of PbCuTe2O6 measured at temperatures of T < 0.1 K.
a, b Excitation spectra obtained on powder and single crystal using the time-of-flight spectrometer LET, with an incident energy of Ei = 5.6 meV and Ei = 5.4 meV respectively. These plots clearly show the presence of a diffuse, dispersionless continuum of magnetic excitations originating at |Q| ≈ 0.8 Å−1 extending up to E ≈ 3 meV. c Powder magnetic intensity plotted as a function of energy for data collected on LET with Ei = 5.6 meV (resolution δE = 0.18 meV, integration range 0.5 ⩽ |Q| ⩽ 1.2 Å−1), Ei = 2.7 meV (δE = 0.08 meV, 0.55 ⩽ |Q| ⩽ 1.1 Å−1) and Ei = 1.6 meV (δE = 0.03 meV, 0.56 ⩽ |Q| ⩽ 1.0 Å−1). The background of each dataset has been subtracted and the datasets have been normalised to each other. The shaded area (E < 0.15 meV) indicates the region below which data is unreliable due to subtraction of the incoherent background. The error bars here represent statistical errors. d Similiar plot for single crystal data measured on LET with incident energies Ei = 5.4 meV (resolution δE = 0.18 meV, integration range 0 ⩽ [h, h, 0] ⩽ 0.6 r.l.u, −2.75 ⩽ [0, 0, l] ⩽ −0.25 r.l.u), Ei = 2.3 meV (δE = 0.06 meV, −1 ⩽ [h, h, 0] ⩽ 1 r.l.u, −1.95 ⩽ [0, 0, l] ⩽ −0.95 r.l.u) and Ei = 1.3 meV (δE = 0.03 meV, 0.95 ⩽ [h, h, 0] ⩽ 2.4 r.l.u, −2.97 ⩽ [0, 0, l] ⩽ 2.97 r.l.u). e–g Single crystal spectra measured on the MACS spectrometer in the [h, k, 0]–plane at constant energy transfers of E = 0.75 meV, 1.5 meV and 2 meV respectively. Non-magnetic features such as phonons and Bragg peak tails have been removed from the spectrum. The colour map at 0.75 meV reveals a broad, diffuse ring-like feature at |Q| ≈ 0.8 Å−1 whose intensity modulates with maxima at (1.69, ±0.3, 0), and equivalent positions. Similar features are present at higher energies with reduced intensity. The uncertainties in figures c, d represent s.e.m.

