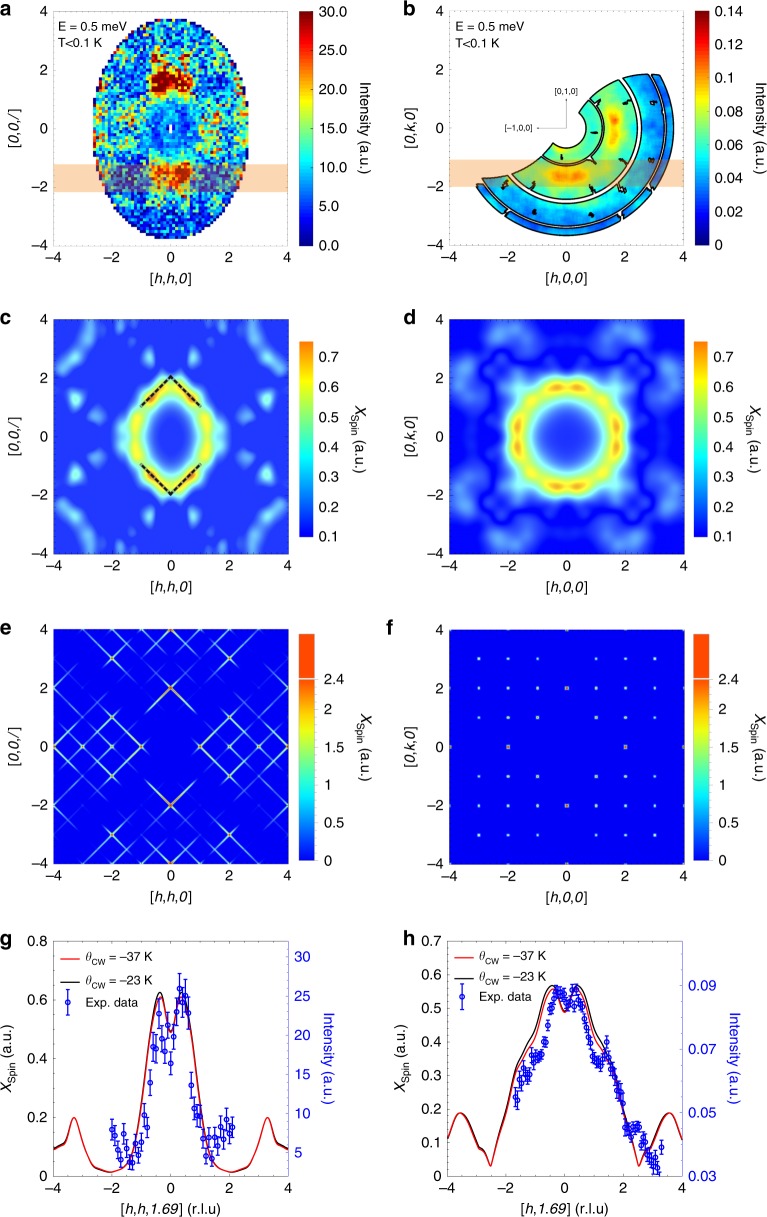
Fig. 4. The low-energy magnetic excitation spectrum of PbCuTe2O6 compared to theory.
The colour maps in a, b show the excitations measured at energy transfer E = 0.5 meV and temperature T < 0.1 K in the [h, h, l]- and [h, k, 0]–planes respectively. The [h, h, l]-map was measured using the LET spectrometer with an incident energy of Ei = 5.46 meV. The data has been integrated over energy transfer 0.4 ⩽ E ⩽ 0.6 meV, and out-of-plane wave-vector transfer −0.1 ⩽ [h, −h, 0] ⩽ 0.1 r.l.u. The [h, k, 0] spectrum was measured on the ThALES spectrometer with an energy resolution of 0.097 meV. c, d Static (real valued) spin susceptibility calculated using the pseudo-fermion functional renormalisation group (PFFRG) method in the quantum limit (S = 1/2) for J1 = 1.13 meV, J2 = 1.07 meV, J3 = 0.59 meV and J4 = 0.12 meV (corresponding to a Curie-Weiss temperature θCW = −23 K). The dashed black lines indicate the positions of strong scattering in the classical J1 − J2-only model [see e, f]. e, f Corresponding classical PFFRG results obtained in the limit of large spin magnitude for a model with only J1 and J2 couplings of equal strength. g, h The experimental and theoretical magnetic intensity as a function of wave-vector transfer along [h, h, −1.69] and [h, −1.69, 0] respectively. The data points (blue circles) were measured at an energy transfer E = 0.5 meV and temperature T < 0.1 K and were obtained by integrating the data shown in a, b over the respective shaded regions. The solid lines show the theoretical intensity obtained by performing the same integration through the theoretical simulations shown in c, d. The theoretical intensity distribution is also shown for another set of exchange interactions represented by their corresponding Curie-Weiss temperature θCW = −37 K (see Fig. 1c). The calculations in c–h are corrected for the Cu2+ form factor and the error bars in g, h represent s.e.m.

