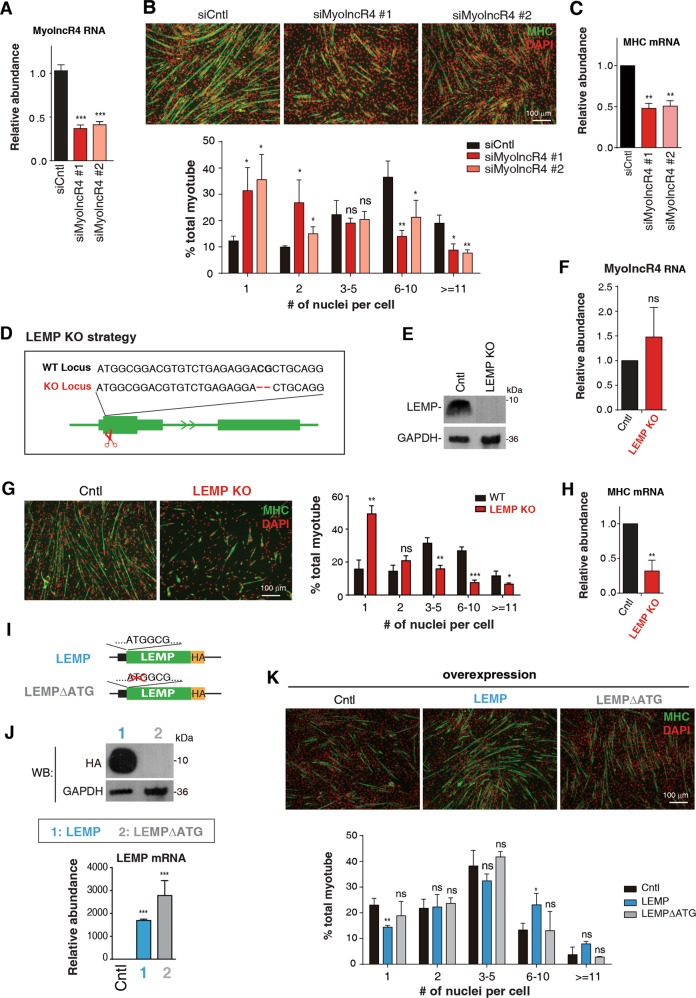
Fig. 2. LEMP promotes myogenic differentiation.
a RT-qPCRs to examine MyolncR4 knockdown efficiency. The bars show RNA levels relative to GAPDH. Error bars, standard deviations (n = 3). Statistical analysis was performed using Student’s t test. ***P < 0.001. b (Top): IF with the MHC antibody to examine differentiation of C2C12 transfected with Cntl and MyolncR4 siRNAs. DAPI staining to mark the nuclei. MHC: green; DAPI: red. Scale bar, 100 μm. (Bottom): Quantitation of the number of nuclei present in myotubes. Error bars, standard deviations (n = 3). Statistical analysis was performed using Student’s t test. **P < 0.01, *P < 0.05, ns: not significant. c RT-qPCRs to examine MHC mRNA levels in MyolncR4 knockdown cells. The bars show RNA levels relative to GAPDH. Error bars, standard deviations (n = 3). Statistical analysis was performed using Student’s t test. **P < 0.01. d Illustration of the LEMP KO strategy. e Western blot to examine LEMP expression in Cntl or LEMP KO cells. GAPDH was used as a loading control. f RT-qPCRs to examine MyolncR4 RNA levels in Cntl and LEMP KO cells. The bars show RNA levels relative to GAPDH. Error bars, standard deviations (n = 3). Statistical analysis was performed using Student’s t test. Ns: not significant. g (Left): IF with the MHC antibody to examine differentiation of Cntl or LEMP KO cells. DAPI staining to mark the nuclei. MHC: green; DAPI: red. Scale bar, 100 μm. (Right): Quantitation of the number of nuclei present in myotubes. Error bars, standard deviations (n = 3). Statistical analysis was performed using Student’s t test. ***P < 0.001, **P < 0.01, *P < 0.05, ns: not significant. h RT-qPCRs to examine MHC mRNA levels in Cntl and LEMP KO cells. The bars show RNA levels relative to GAPDH. Error bars, standard deviations (n = 3). Statistical analysis was performed using Student′s t test. **P < 0.01. i Schematic of the LEMPΔATG construct. The start codon of LEMP was deleted. j Western blot and RT-qPCRs to examine LEMP protein and mRNA levels in C2C12 cells transfected with equal amount of Cntl, LEMP-HA, and LEMPΔATG-HA constructs. k (Top): IF with the MHC antibody to examine differentiation of C2C12 cells transfected with plasmid expressing LEMP, LEMPΔATG at 4 days after differentiation induction. DAPI staining to mark the nuclei. MHC: green; DAPI: red. Scale bar, 100 μm. (Bottom): Quantitation of the number of nuclei per myotubes. Error bars, standard deviations (n = 3). Statistical analysis was performed using Student’s t test. ***P < 0.001, **P < 0.01, *P < 0.05, ns: not significant.

