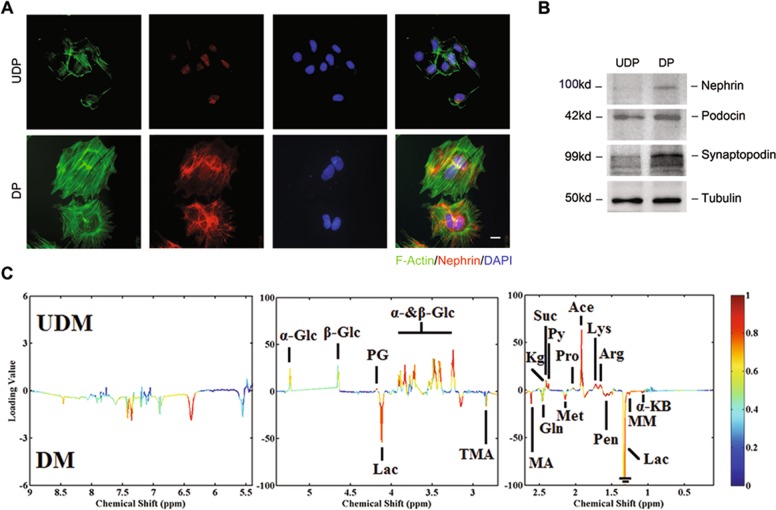
Fig. 1. Metabolomics analysis revealed higher lactate production in differentiated podocytes.
a Immunofluorescence staining for nephrin (red), phalloidine for F-actin (green) and DAPI for nuclear (blue) in undifferentiated podocytes (UDPs) or differentiated podocytes (DPs) as indicated (n = 5). Scale bar=5 μm. b Representative western blotting results of nephrin, podocin and synaptopodin confirm the differentiation of podocytes (n = 3). c Representative map of 1H-NMR spectra in the extracellular medium incubated with the presence of different podocytes (n = 6). UDM: undifferentiated podocyte medium; DM: differentiated podocyte medium. The map shows the significance of metabolites variations between these two classes. Peaks in the positive direction indicate metabolites that are more abundant in the UDM groups. Consequently, metabolites that are more abundant in DM are presented as peaks in the negative direction.

