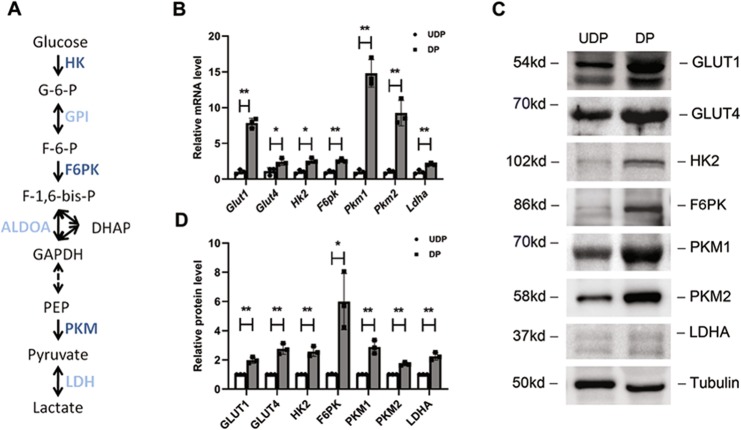
Fig. 2. Glycolysis-related genes and proteins were upregulated in differentiated podocytes.
a Glycolytic pathway with the assayed glycolytic genes in dark blue. b Real-time PCR analysis of glycolysis-related mRNAs performed in UDPs and DPs. mRNAs were normalized to actin and compared to UDPs (n = 3). c Representative blot images of glycolysis-related proteins (n = 3). d All proteins were normalized to tubulin and compared to UDPs. *P < 0.05, **P < 0.01, determined by t test. Data are shown as the means ± SD.

