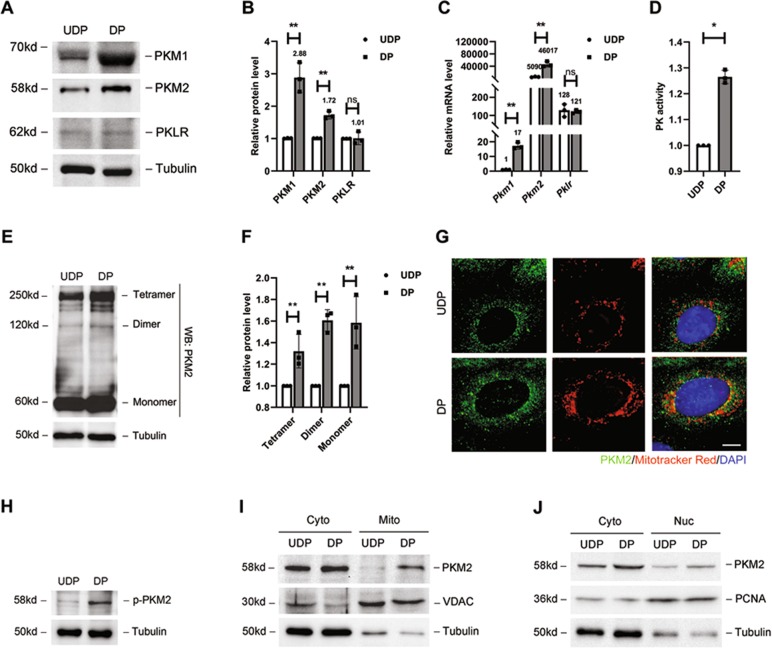
Fig. 5. Regulation of PKM2 during in vitro podocyte differentiation.
a Representative blot image of PKM1, PKM2, PKLR proteins (n = 3) in podocytes. b Bar charts show means of optical density (O.D.), and normalized to undifferentiated podocytes. c Real-time PCR analysis of Pkm1, Pkm2 and Pklr mRNAs performed in UDPs and DPs. Relative expression level was compared to Pkm1 in UDPs (n = 3). d PK activity in podocytes as indicated (n = 3). e Representative blot image of cross-linked podocytes (n = 3). f Tetramer, dimer and monomer PKM2 were compared to tubulin and normalized with undifferentiated podocytes (n = 3). g Immunofluorescence staining for PKM2 (green), mitochondria (red) and DAPI (blue) in podocytes as indicated. Mitochondria and nuclear from mature podocytes showed more staining of PKM2 (n = 10). Scale bar=2 μm. h Representative blot image of phosphorylated PKM2 on Tyrosine 105 (n = 3). i–j Mitochondria and nuclear fractions were prepared from undifferentiated or differentiated podocyte. Western blot analysis of cytosolic, mitochondrial and nucleonic fractions was performed to evaluate translocation of PKM2 from the cytosolic compartment to mitochondria and nuclear. *P < 0.05, **P < 0.01, determined by t test. Data are shown as the means ± SD.

